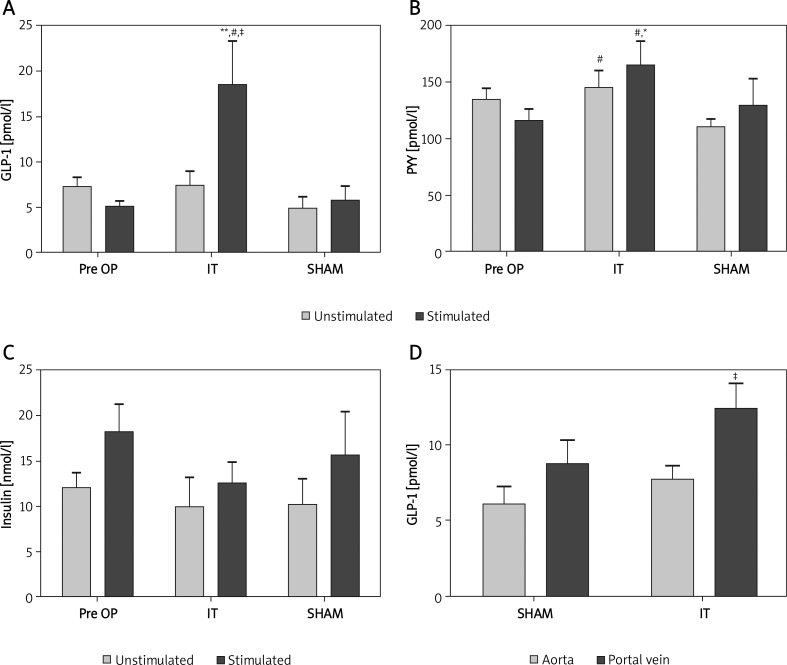
Figure 4.
GLP-1, PYY and insulin levels, determined by multiplex ELISA 2 weeks postoperative. A – Glucosestimulated GLP-1 levels in the IT group (n = 9) were significantly raised, compared to preop. levels (**p < 0.01), SHAM (# p < 0.05) and fasted (unstimulated) IT animals (‡ p < 0.05). B – IT animals displayed raised PYY levels compared to SHAM animals (#Unstim./stim. p < 0.05 for both) and compared to preoperative levels (*stimulated p < 0.05). C – Insulin levels remained unchanged when compared to preoperative levels and sham animals. D – Simultaneously determined, portal GLP-1 levels were higher compared to aortic levels in IT animals (‡ p < 0.05)

