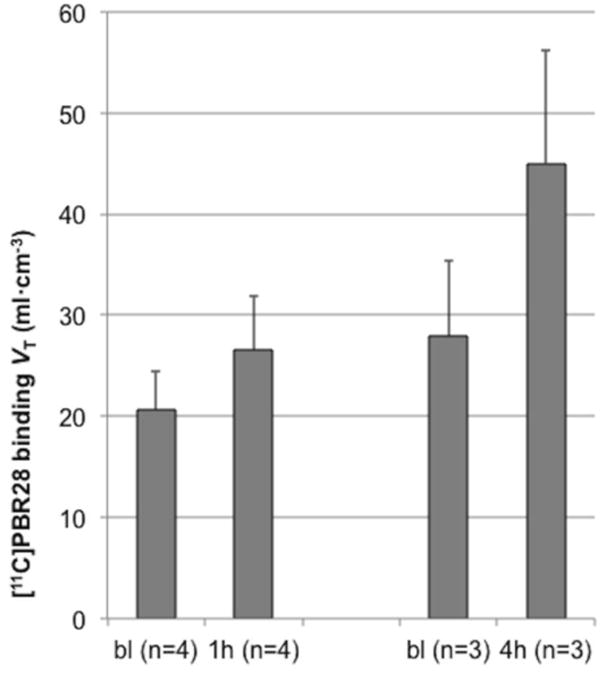
Fig. 3.

Mean change in [11C]PBR28 binding (VT) after LPS administration. In this figure the mean of each set of scans (1h and 4h post-LPS) is compared to their respective baseline means. One hour post-LPS (n = 4), [11C]PBR28 binding increased 28.8±15.7% (range 11.5%-47.4%). Four hours post-LPS (n = 3), [11C]PBR28 binding increased 61.8±34.4% (range 35.6%-100.7%). Error bars denote standard deviation. Abbreviations: bl, baseline; VT, total volume of distribution.
