
Fig. 4.
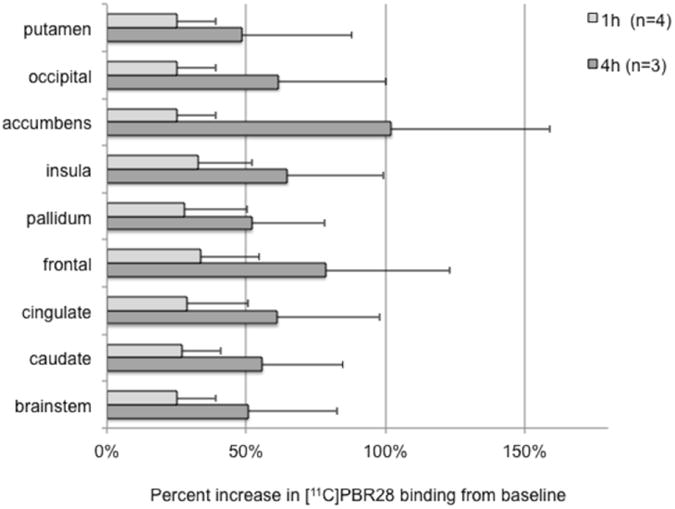
Percent increase in binding from baseline in each region of interest (ROI). The light gray bars show mean (n = 4) percent increase from 0h to 1h in each ROI, while the dark gray bars show mean (n = 3) percent increase from 0h to 4h. Error bars denote standard deviation.