Figure 5.
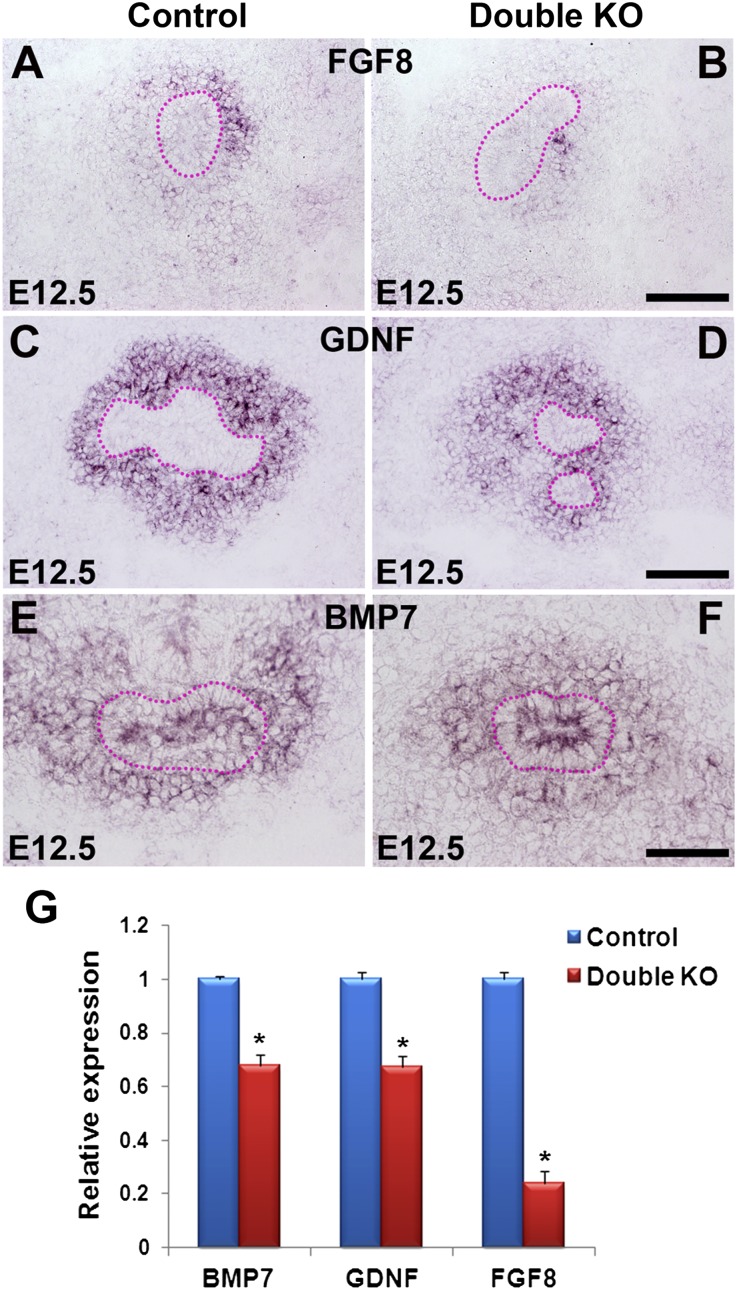
Analysis of secreted growth factor expression in E12.5 kidneys. (A–F) In situ hybridization shows Fgf8 expression in the MM of the control (A) but greatly reduced expression in the DKO (Dlg1fl/fl;Caskfl/fl;Six2-EGFP/Cre) (B); strong Gdnf expression in the MM of the control (C) and moderately reduced expression in the DKO (Dlg1fl/-;Caskfl/fl;Six2-EGFP/Cre) (D); and slightly reduced Bmp7 expression in the DKO (Dlg1fl/-;Caskfl/fl;Six2-EGFP/Cre) (F) compared with control (E). UBs are outlined by dotted lines in A–F. (G) Quantitative RT-PCR analysis of E12.5 kidney RNA demonstrates reduced expression of Bmp7, Gdnf, and Fgf8 in the double mutants compared with control. Data represent mean values; bars indicate SEM. *P<0.05. Scale bars in A–F, 100 µm.

