
Figure 3. Clustering and assignment of B.schlosseri chromosomes.
(A) We isolated and sequenced 21 metaphase chromosome mixtures using a microfluidic device. Each chromosome mixtures was amplified, barcoded and sequenced separately (IlluminaHiSeq). Genomic contigs larger than 7 kb were aligned to the chromosome reads using BWA. Subsequently, assignment of scaffolds to chromosome cluster was performed using iterative K-means clustering on the correlation matrix between each scaffold. In addition, to find the number of clusters/chromosomes we performed k-means clustering iteratively across different cluster numbers. This plot demonstrates that increasing beyond 13 clusters does little to reduce the error; therefore 13 chromosomes were successfully resolved. (B) To estimate the configuration after the clustering step, 17 out of the 21 wells were deduced to contain information that is used in the clustering process. The average number of normalized reads counts from each metaphase chromosome mixture (well) that align to each scaffold in a cluster group was calculated and plotted. Each peak represented can be inferred to denote the presence of a specific chromosome in the well. Examples of four representative wells are presented, metaphase chromosome mixtures contained between 1–4 chromosomes (see also Figure 3—figure supplement 1).
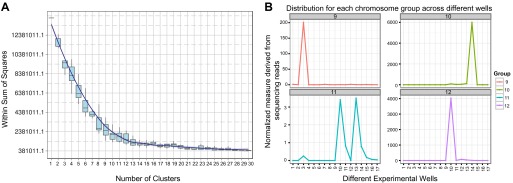
Figure 3—figure supplement 1. Distribution of B. schlosseri chromosome groups across different wells.

Figure 3—figure supplement 2. Pipeline for the assignment of chromosome scaffolds and the 356a–chromosomes hybrid assembly process.

Figure 3—figure supplement 3. 356a-Chromosome hybrid assembly of B. schlosseri.

Figure 3—figure supplement 4. The fraction of B. schlosseri predicted intron-less genes (blue) and genes with introns (red) in the different chromosomes.
