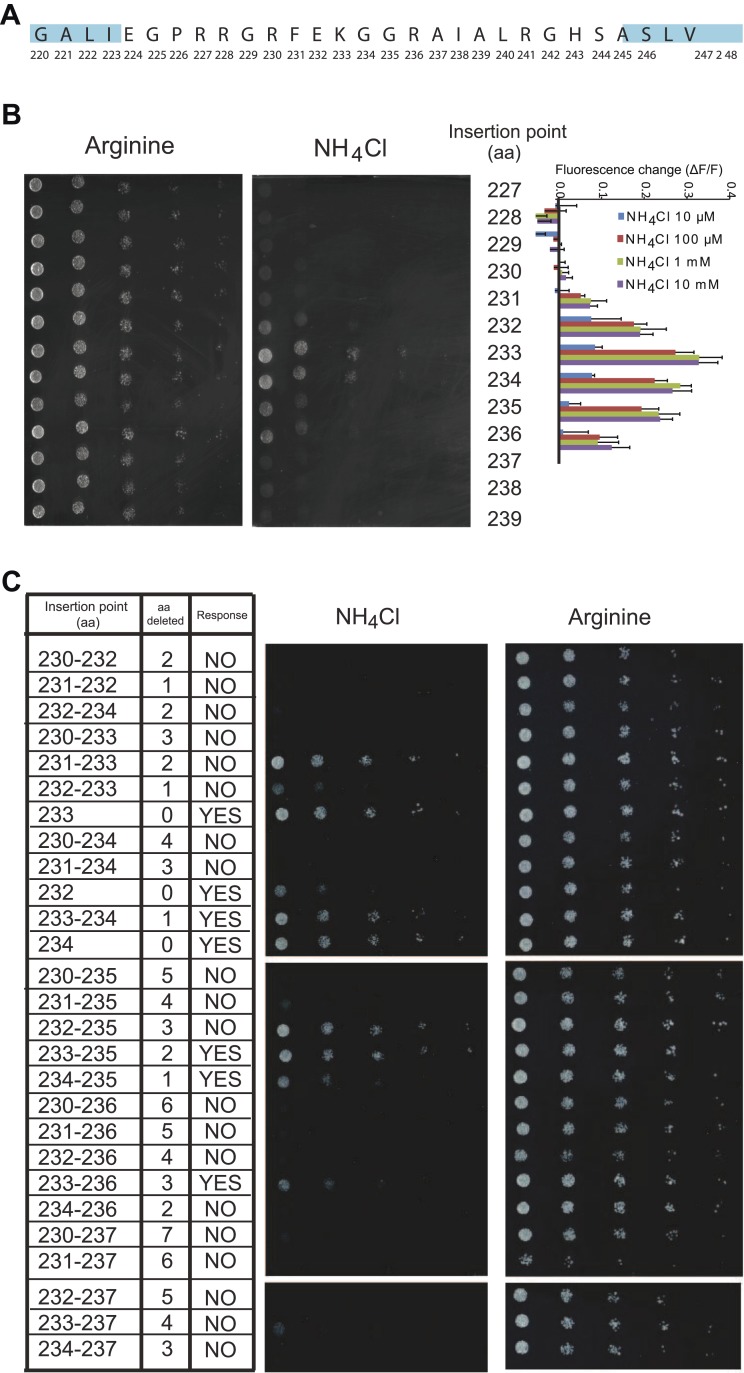
Figure 3. Effect of L5 on transport and fluorescence response.
(A) Amino acid sequence of the L5–6 region of AMT1;3. Residues in ‘blue’ correspond to TMH 5 (left) and TMH 6 (right). (B) Influence of the insertion position of mcpGFP into L5 on transport activity and fluorescence response. Left panels show the growth assay of the yeast Δmep1,2,3 strain transformed with insertion variants on solid media containing 2 mM NH4Cl or 1 mM arginine (growth control) as the sole nitrogen source for 3 days. Numbers indicate the insertion site within AMT1;3 (residue preceding the point of insertion of mcpGFP). Right graph shows the fluorescence response of the variants to addition of the indicated concentrations of NH4Cl. Data were normalized to the water-treated control (0; mean ± SE; n = 2). (C) Growth and response of AmTrac variants with deletions in L5–6. Growth was analyzed as described in Figure 2A. Numbers in the left column indicate the position of the insertion in AMT1;3; two numbers indicate residues preceding and following the mcpGFP insertion. Right column named “Response” indicates whether the corresponding variant responded to addition of 1 mM NH4Cl with a fluorescence change. The original AmTrac corresponds to insertion after aa 233.

