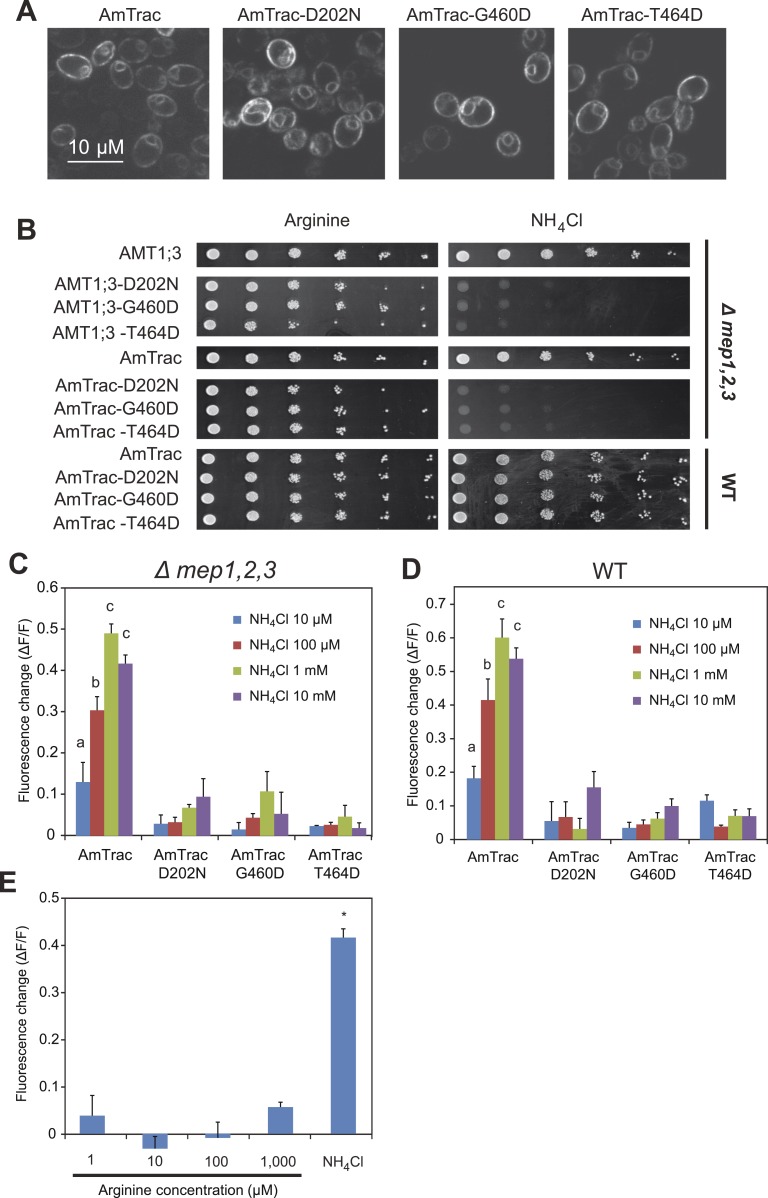
Figure 6. AmTrac mutant analysis.
(A) Confocal z-section of yeast expressing AmTrac or its inactive variants carrying mutations D202N, G460D or T464D. Bar 10 µm. (B) Growth complementation of the Δmep1,2,3 or wt yeast expressing AmTrac or its inactive variants on solid media containing 2 mM NH4Cl or 1 mM arginine (growth control) as sole nitrogen source for 3 days. Endogenous MEPs in wt strain are not affected by expression of mutant variants. (C) Fluorescence response of Δmep1,2,3 or (D) wt yeast expressing AmTrac or the transport-inactive variants D202N, G460D or T464D. Data were normalized to water-treated controls (0) (mean ± SE; n = 3). Only yeast cells expressing AmTrac showed significantly different responses (SNK test: p<0.01). (E) Response of AmTrac to addition of arginine. Fluorescence response of Δmep1,2,3 yeast cells expressing AmTrac treated with the indicated concentrations of arginine or 1 mM NH4Cl. Data were normalized to water-treated controls (0) (mean ± SE; n = 3). Only the ammonium treatment was significantly different from control (SNK test: *p<0.01). Note that arginine addition to yeast cells has been shown to lead to increased cytosolic levels of ammonium (Marini et al., 1994).

