
Figure 4.
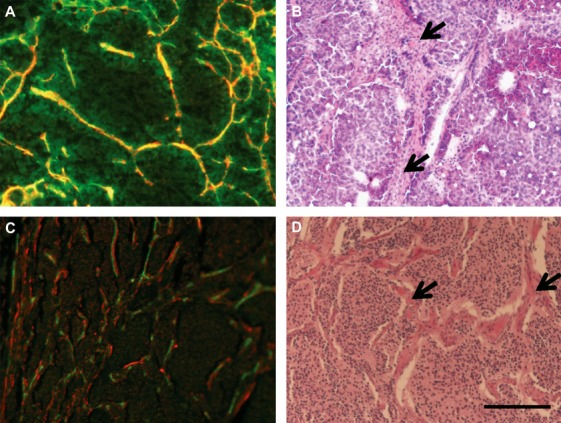
Immunostaining for endothelial cells and pericytes (A and C) and H&E staining (B and D) of mouse adrenal tumors (A and B) and human neuroblastoma (C and D). In (A) and (C), the green signals indicate endothelial cells; and the red signals, α-SMA-positive pericytes. The arrows in (B) and (D) indicate stromal cells. Scale bar = 200 μm.