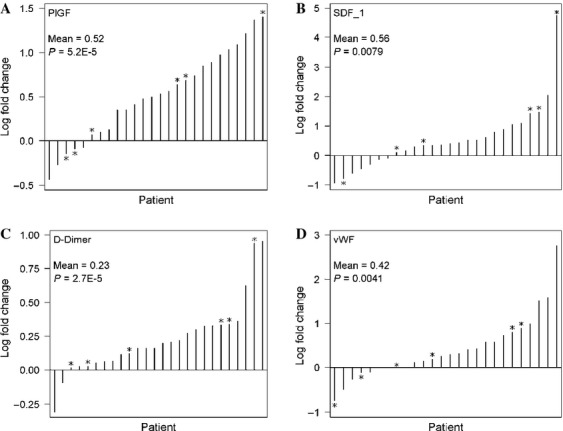
Figure 1.

Waterfall plots of the fold change in PlGF (A), SDF-1 (B), D-dimer (C), and vWF (D) plasma levels on drug treatment in all patients. Each bar represents the log2 fold change (end of cycle 1/baseline) of the plasma analyte in a single patient, arranged in ascending order. *Patients that had PR or SD >1 year. The mean log2 ratios and P-value (one-sample Wilcoxon signed-rank test) are included in the inset of each graph. SDF-1, stromal-derived factor 1; PlGF, placental growth factor; vWF, von Willebrand factor; SD, standard deviation.
