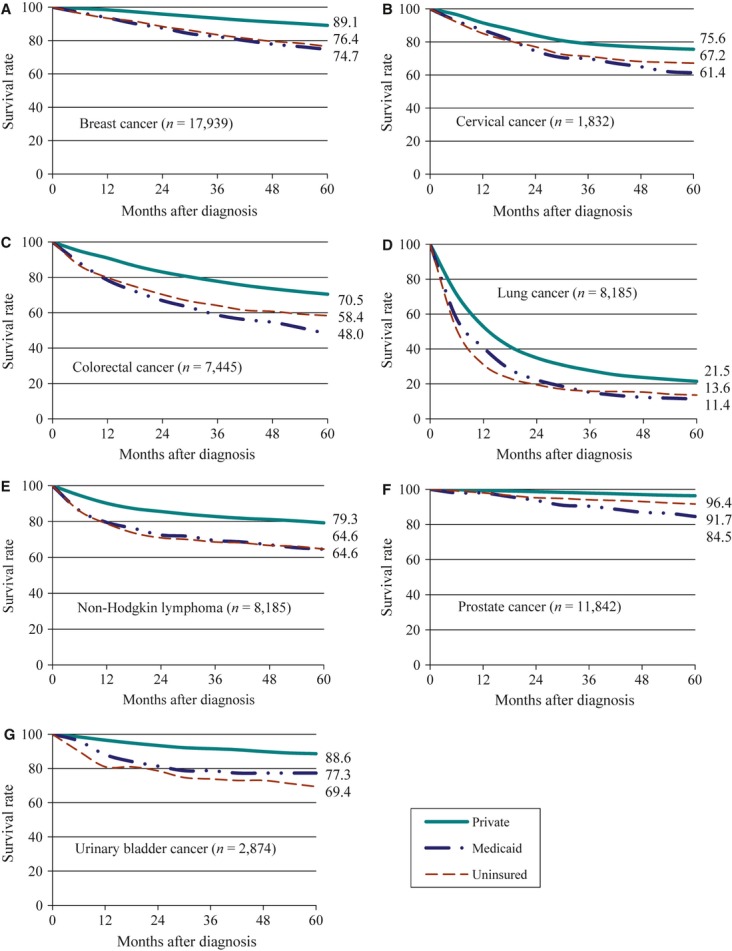
Figure 1.

Five-year cause-specific survival rates by health insurance status for each cancer type, New Jersey, 1999–2004. The rates were significantly different by insurance status for each cancer type (Kaplan–Meier log-rank tests, P < 0.0001). The total numbers of cancers and cause-specific 5-year rates are labeled in each figure.
