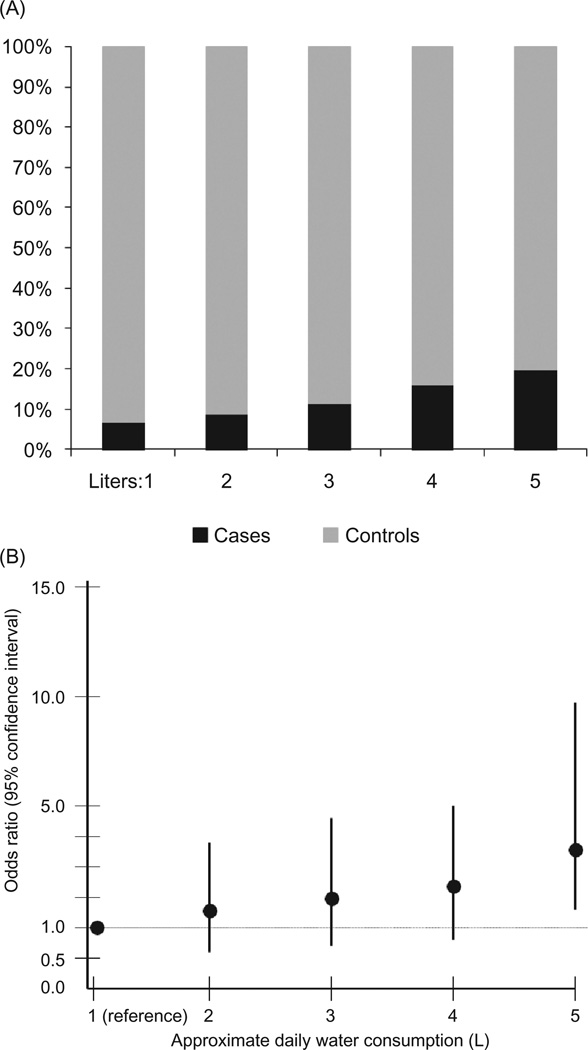
FIGURE 2.
(A) The percentage of cases and controls across reported levels of daily water consumption (in liters). (B) The odds ratios and 95% confidence intervals from the exploratory multivariable analysis that includes the entire study population (n = 997) for the association of increasing levels of water consumption with renal insufficiency (eGFR of ≤60 mL/min/1.73 m2 vs. eGFR ≥ 80 mL/min/1.73 m2). Consumers of 1 L of water per day are the referent group.

