
Figure 6.
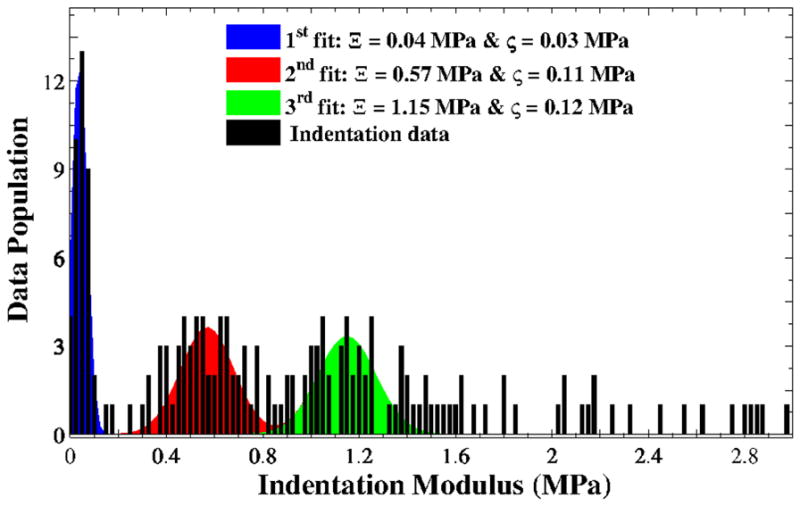
Distributions of data population versus indentation modulus E from nanoindentation of a vocal fold tissue sample; blue curve for the first fit corresponding to non-collagenous ECMs; red curve for the second fit associated with collagen fibrils type III; green curve as the third fit associated with collagen fibrils type I; black bars for the indentation moduli. A combination of the second and third Gaussian distributions was considered as the stiffness of collagen fibrils.