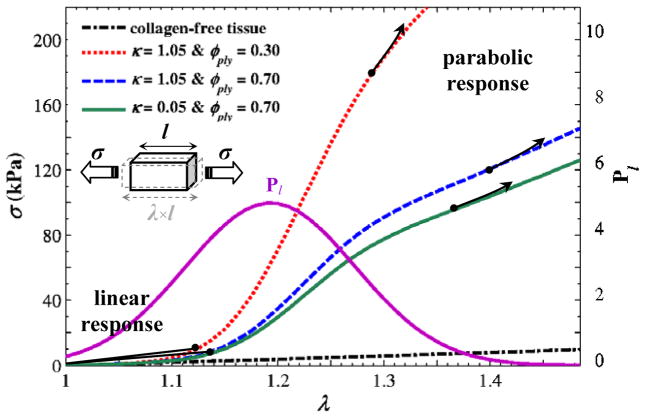
Figure 8.
Distributions of axial stress σ versus axial stretch λ for a representative block material of the tissue, obtained by Eq. (9); dot-dashed black line for a case of collagen-free material model, Ψfibril = 0; dotted red line for κ = 0.05 and φply = 0.30; dashed blue line for κ = 0.05 and φply = 0.70; solid green line for κ = 1.05 and φply = 0.70. See also Eq. (10) Eq. (11). The distribution from the free-length probability function in Eq. (6) is also shown using a pink line. The black arrows show the initiation of the second-order parabolic response.

