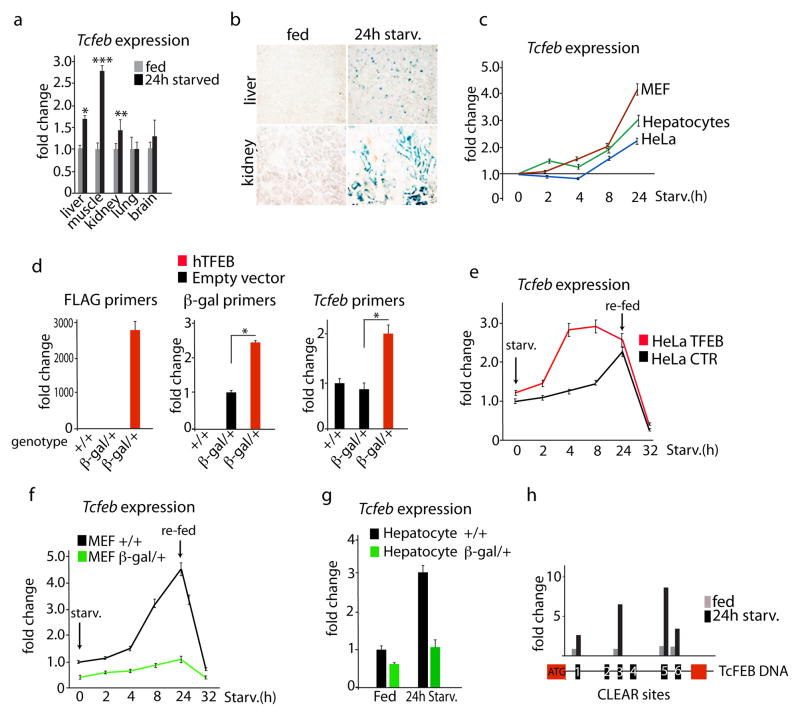
Fig. 1. Autoregulation of TFEB during starvation.
a) Expression levels of Tcfeb mRNA in tissues isolated from 24h-fasted (starv) 6 week old mice. Values are expressed as fold change relative to Tcfeb expression in mice fed ad libitum (fed). Bars represent mean±s.d. for n=5; *P≤0.05; **P≤0.01; ***P≤0.001. b) Representative β-gal staining of liver and kidney frozen sections isolated from fed and 24h–fasted heterozygous Tcfeb-β-gal mice. c) Time-course expression analysis of TFEB in wild-type HeLa cells, MEFs and hepatocytes after addition of starvation media (time 0). Bars represent mean±s.d. for n=3 independent experiments. d) Expression levels of transfected hTFEB-Flag, Tcfeb-β-gal fusion transcript and endogenous Tcfeb mRNAs in MEFs isolated from control (+/+) and heterozygous Tcfeb-β-gal/+ mice. Bars represent mean±s.d. for n=3 e) Time-course expression analysis of TFEB mRNA in control or TFEB-overexpressing HeLa cells during fasting and re-feeding. Primers specific for the endogenous TFEB were used. Bars represent mean±s.d. for n=3 f) Time-course expression analysis of Tcfeb mRNA in heterozygous Tcfeb-β-gal/+ or control MEFs during fasting and re-feeding. Specific primers for the endogenous Tcfeb were used. Bars represent mean±s.d. for n=3 g) Expression analysis of Tcfeb mRNA in heterozygous Tcfeb-β-gal/+ or control hepatocytes in fed and after 24h fasting. Bars represent mean±s.d. for n=3 h) Chromatin immunoprecipitation (ChIP) analysis from liver of mice fed ad libitum or 24h-fasted. The CLEAR elements in the first intron of Tcfeb genomic DNA are shown as numbered black boxes as indicated in Supplementary Table 1. Red boxes represent exons, and the ATG indicates the first codon (from the mouse Tcfeb isoform b). The histogram shows the amount of immunoprecipitated DNA as detected by qPCR assay. Values were normalized to the input and plotted as relative enrichment over a mock control. Data represent mean ± s.d of three independent experiments.

