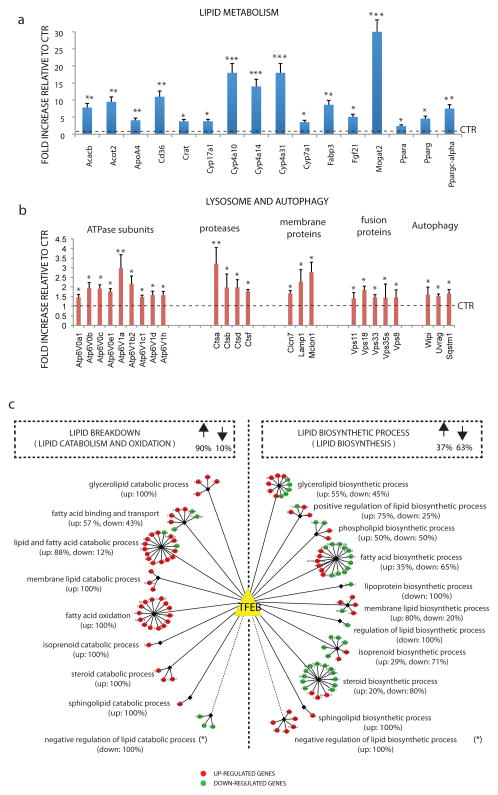
Fig. 2. The TFEB lipid metabolism network.
a, b) mRNA levels of the indicated genes involved in (a) lipid metabolism and in (b) autophagy and lysosome pathway were quantified by qRT–PCR in total RNA isolated from liver samples of mice infected with HDAd-TFEB virus. GAPDH was used as a control. Values are mean± s.d for n=3 and are expressed as fold increase compared to control mice (injected with transgeneless viral vector). * p<0.05; **<0.01. Control levels are indicated by dashed line. c) The 124 genes with a known role in the lipid metabolic process, whose expression was perturbed by TFEB overexpression, are represented as coloured circles and assigned to specific lipid breakdown (left) or lipid biosynthesis (right) sub-categories. The percentages of up-regulated (red circles) and down-regulated genes (green circles) are shown both for the two main groups and for each sub-category. *Note that in calculating these percentages genes assigned to the “negative” regulation of lipid catabolic process and to the “negative” regulation of lipid biosynthetic process have been included in the lipid breakdown and in the lipid biosynthesis groups, respectively.

