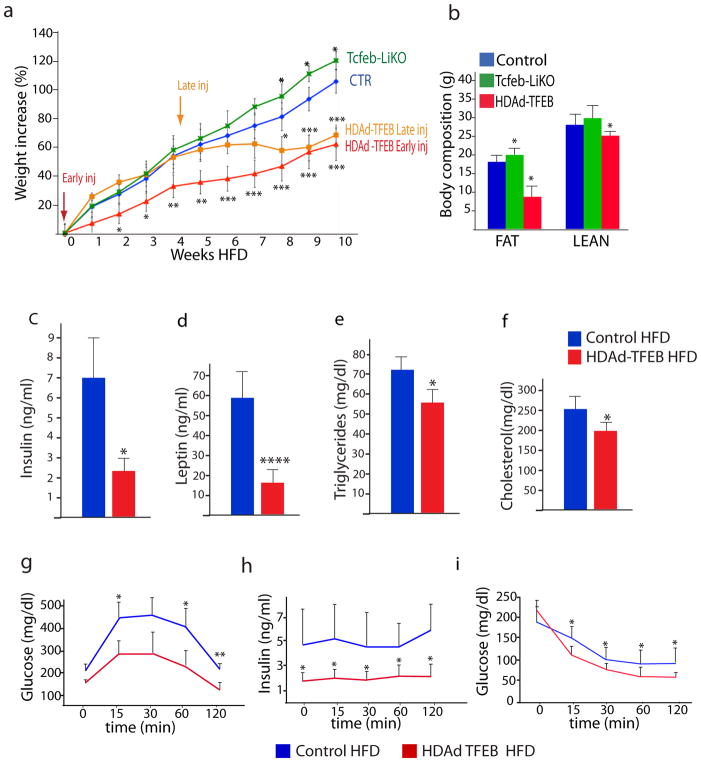
Fig. 7. TFEB prevents diet-induced obesity and metabolic syndrome.
a) Body weight curves of male mice fed with HFD (40% calories from fat) for 10 weeks starting from 5 weeks of age (0 on the x axes). Mice were injected with HDAd-TFEB either 1week before (early inj.), or 4 weeks after, (late inj.) being placed on the HFD, as indicated by the arrows. Values are represented as percentages of weight increase. b) Whole body composition analysis (Echo MRI) of the same mice as in (a) after 10 weeks of HFD. In a and b n=10 mice/group; bars represent mean±s.d. *P≤0.05; **P≤0.01; ***P≤0.001 compared to control HFD group. c–f) Total serum insulin, leptin, triglyceride and cholesterol levels in control and HDAd-TFEB mice kept on high-fat diet (HFD) for 10 weeks. Value are mean ±s.d. n=10. *P≤0.05; ****P≤0.0001 compared to control. g–i) Glucose and insulin tolerance tests in control and HDAd-TFEB mice challenged with HFD for 10 weeks. (g) Glucose and (h) serum insulin levels at the indicated time points after glucose challenge. (i) Glucose levels at the indicated time points after insulin challenge. In g,h,i value are mean ±s.d. n=7 mice/group; *P≤0.05; **P≤0.01; ***P≤0.001 compared to control. Mice injected with an empty HDAd virus behaved as wild-type untreated mice, therefore data is not represented in the figure.

