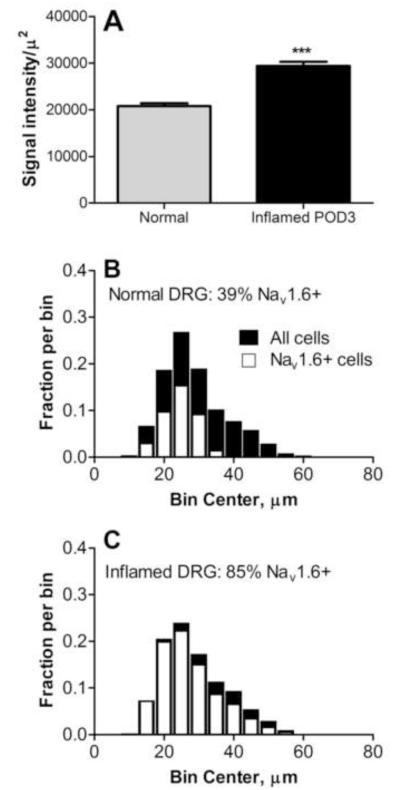
Figure 3.
NaV1.6 in inflamed DRG. A, Intensity of NaV1.6 staining was higher in DRG sections from inflamed (POD3; n = 144 sections) than in normal DRG (n = 155 sections; Mann-Whitney test). B, C: size distribution of NaV1.6 positive (white) and all (black) neurons in normal and inflamed DRG. N=6000-6500 cells per group. The distributions for the NaV1.6 positive cells were scaled by the overall fraction of NaV1.6 positive neurons. The scoring included lightly stained cells as well as more intensely stained cells.

