
Figure 2. Effects of METH neurotoxicity on evoked phasic-like DA signals.
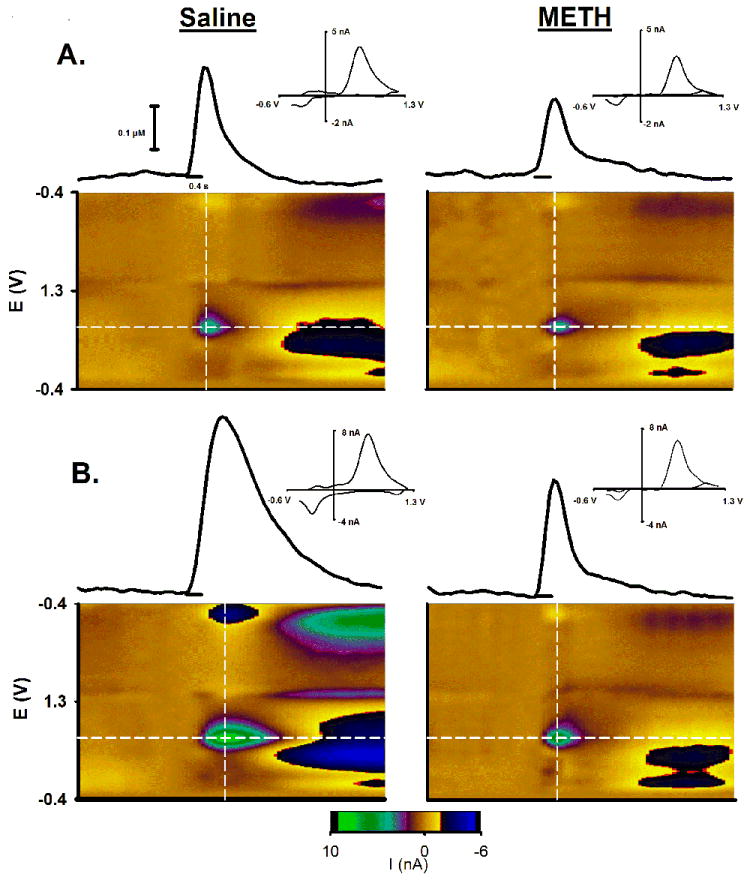
Representative evoked phasic-like DA signals in the DMS (A) and NAc (B) are shown for saline- and METH-pretreated animals (left and right columns, respectively). The FSCV recording (solid line) in the middle of each panel shows the evoked DA trace, with the pulse train demarcated by the shorter line underneath. Immediately below the trace and stimulation is the pseudocolor plot showing all background-subtracted cyclic voltammograms collected in this recording graphed sequentially in time. The evoked trace shown above the plot was collected at the peak oxidation potential for DA identified by the horizontal white line in the pseudocolor plot. Individual background subtracted cyclic voltammograms (above INSET) were determined at the apex of the evoked trace along the vertical white line in the pseudocolor plot. See Figure 1 for details of the pseudocolot plot.