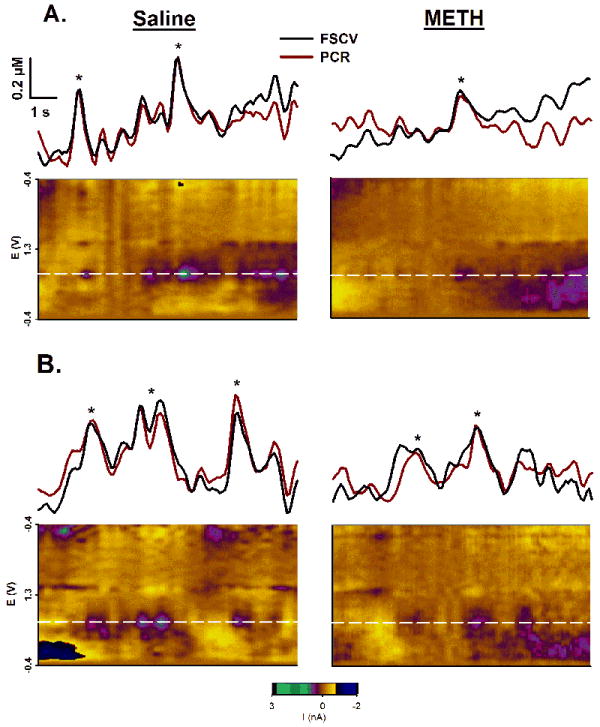
Figure 4. Effects of METH neurotoxicity on spontaneous DA transients.

Representative recordings show spontaneous phasic DA transients in the DMS (A) and NAc (B) for saline- and METH-pretreated animals (left and right columns, respectively). See Figure 1 for details. The horizontal white line in the pseudocolor plot, demarcating measured current collected at the peak oxidative potential for DA, defines the above FSCV trace (black line) after converting current to concentration. The red line is the PCR output for the identical recording segments. *, DA transient identified by peak-finding software.
