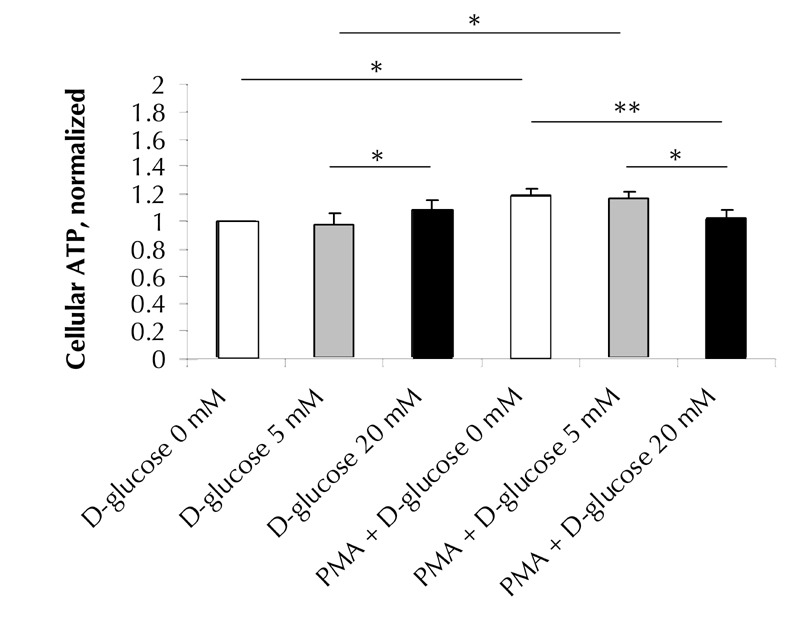
Figure 3. Changes in cellular ATP in erythrocytes acutely exposed to various concentrations of D-glucose.

Erythrocytes, either pretreated with 25 µM PMA or untreated, were acutely incubated in PBS with 0 mM (white bars), 5 mM (grey bars), or 20 mM D-glucose (black bars). Cellular ATP concentrations were quantified by luciferin-luciferase assay, and normalized to “0 mM D-glucose”-treated cells. Data are means of 8 to 13 independent experiments ± SE. * p < 0.05; ** p < 0.01 vs. correspondent data.
