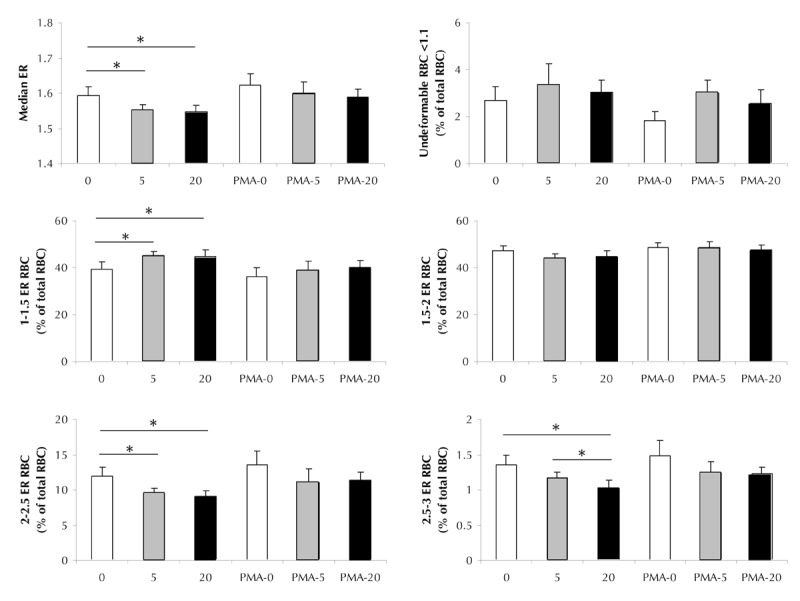
Figure 5. Acute glucose effect on RBC deformability.

The figure shows the elongation ratio (ER) or the percentage from the total RBC population in accordance to ER of erythrocytes incubated in PBS supplemented with with 0 mM (white bars), 5 mM (grey bars), or 20 mM D-glucose (black bars) for 5 min at 37ºC. When indicated, cells were pretreated with 25 µM PMA. A. Median elongation ratio. B. Percentages of undeformable (ER ≤ 1.1) erythrocytes. C. Percentage of erythrocytes with decreased 1.1-1.5 ER deformability. D. Percentage of erythrocytes with median 1.5-2 ER deformability. E. Percentage of erythrocytes with increased 2-2.5 deformability. F. Percentage of erythrocytes with increased 2.5-3.0 deformability. Data are means of 4 to 13 independent experiments ± SE. * p < 0.05; ** p < 0.01 vs. correspondent data.
