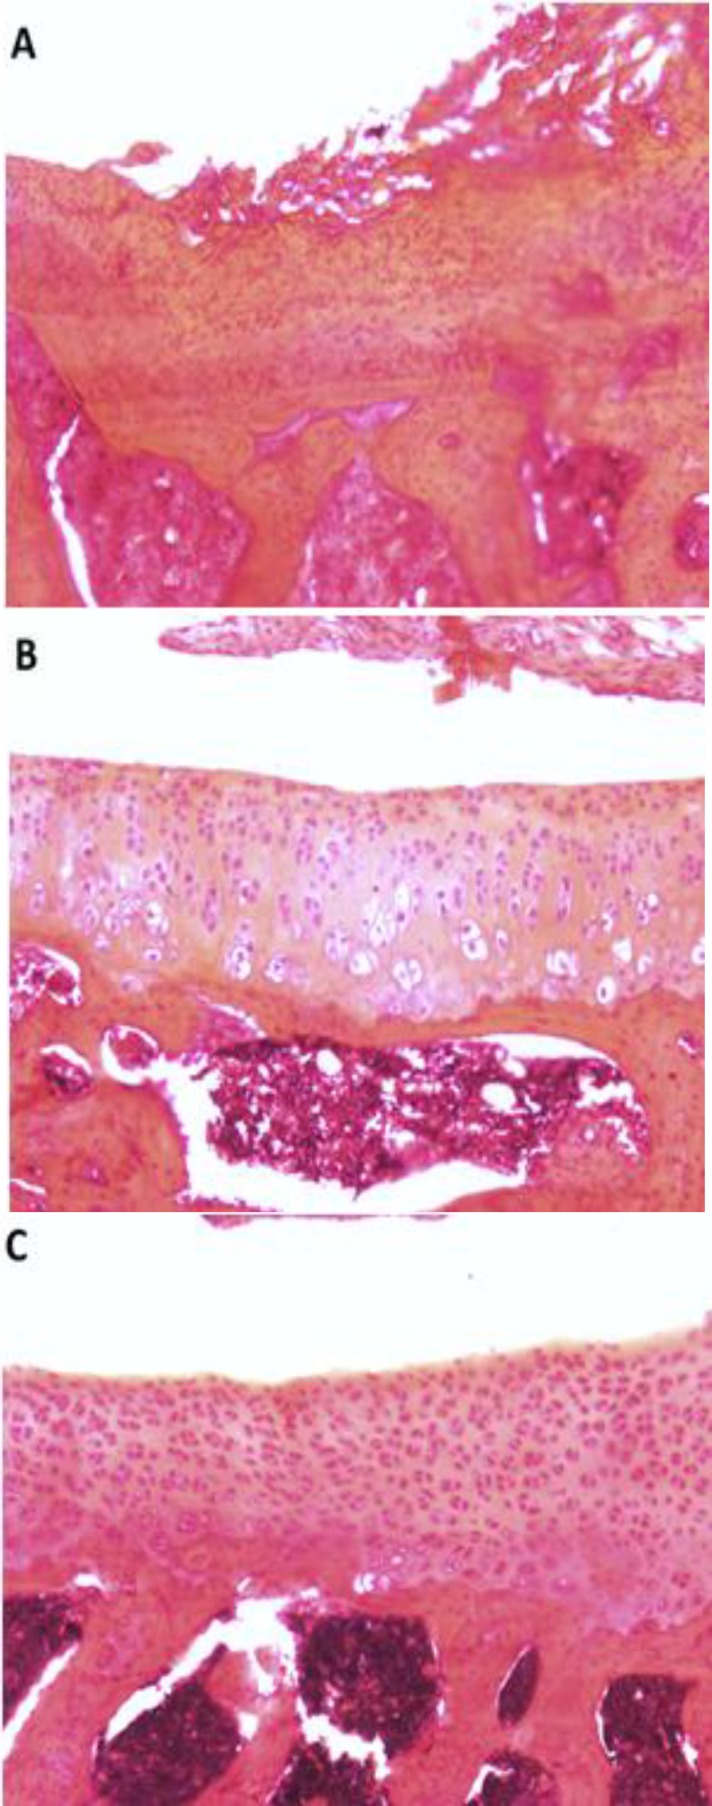
Figure 4.
Photomicrographs of Histomorphological changes of knee joint sections of subjects in each experimental group. Cellularity and surface integrity was evaluated by Hematoxylin-Eosin staining (The original magnification was ×10). A: MIA only rat; OA lesions can be seen by tibial cartilage surface clefts and decrease in cellularity. Note the pink-red sites of lesions. B: Intact control rat; there are no observable changes in cartilage surface. C: Training rat; chondrocytes can be observed in many isogenic groups, which is the indicator of cell division stimulation

