Fig 1.
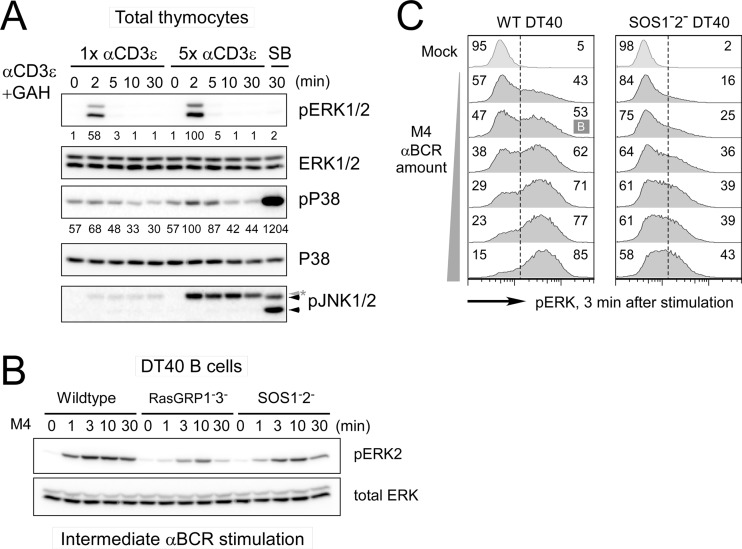
The MAPK ERK activation pattern depends on stimulus dosage and SOS. (A) Activation of MAPK ERK and p38 in total mouse thymocytes induced with 1× (2 μg/ml) and 5× (10 μg/ml) αCD3ε (2C11) stimulation. SB, 30-min stimulation with 0.4 M sorbitol as a positive control for phospho-p38 (pP38) and phospho-JNK1/2 (pJNK1/2; arrowheads). The asterisk indicates a heavy chain of stimulatory antibody. (B) Deficiency in either RasGRP or SOS leads to impaired ERK activation in DT40 cells. Wild-type, RasGRP1− RasGRP3−, and SOS1− SOS2− DT40 cells were activated with an intermediate dosage of M4 anti-BCR stimulation for the indicated time. (C) SOS1/2-deficient DT40 cells do not demonstrate a bimodal pERK pattern after 3 min of BCR stimulation, regardless of the strength of the BCR stimulus (dilution range, 1:32,000 to 1:1,000). Bimodality is statistically tested by Hartigan's analysis. A case with lower than the threshold dip value in Hartigan's unimodality test (P < 0.05) is classified as bimodal (indicated as B), while cases with a P value of >0.05 are considered unimodal. Numbers represent the percentage ratios of maximum phosphoprotein levels normalized to total levels of that specific protein. All data are representative presentations of at least three independent experiments.

