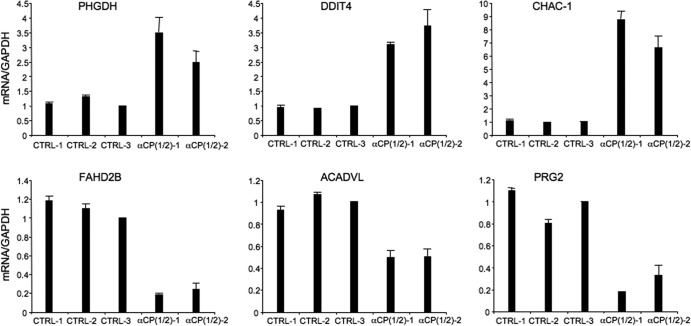
Fig 3.
Confirmation of DRS results by targeted real-time RT-PCR analysis. Results of real-time analyses of three mRNAs that increased and three mRNAs that decreased in overall abundance relative to controls subsequent to αCP depletion (see Table S2 in the supplemental material) are shown. These studies were carried out on the same RNA preparations as were used in the original DRS analysis. To further validate these results, analyses of mRNA levels in K562 cells were additionally carried out with cells treated with a third distinct control siRNA corresponding to an unrelated mRNA (CTRL-3; cyclophilin siRNA). All values shown were normalized to the corresponding levels of GAPDH mRNA. The data are represented as ratios, with the ratio for the CTRL-3 siRNA sample defined as 1.0. The standard deviation for each sample is shown (n = 3).

