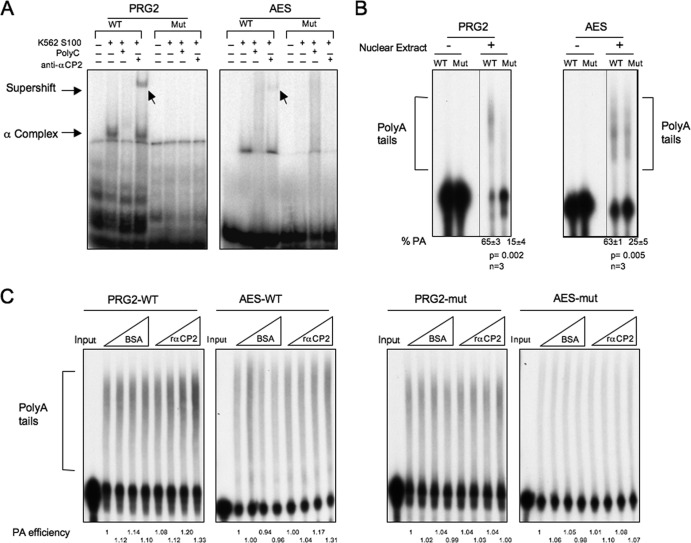
Fig 8.
In vitro polyadenylation assay. 32P-labeled RNA substrates representing the poly(A) addition sites for the PRG2 and AES mRNAs were synthesized by in vitro transcription. In each case, the wild-type (WT) sequence or a sequence of a corresponding substrate containing a mutation of the C-rich region (Mut) was synthesized. (A) EMSA was performed to determine the efficiency of αCP assembly on the WT and Mut templates (as described for Fig. 7). (B) In vitro polyadenylation assay. The 32P-labeled templates were added to an in vitro polyadenylation reaction mixture (HeLa nuclear extract), and the products were resolved on a denaturing polyacrylamide gel. The poly(A) tails were added to the template (bracketed) in the presence (+) but not the absence (−) of the nuclear extract. The polyadenylation efficiency was calculated as the ratio of labeled RNA in the poly(A) tail region divided by total RNA activity (polyadenylated plus remaining substrate). These values (% PA) are shown at the bottom of the respective lanes. Standard deviations, P values, and numbers of repeats (n) are shown below the respective gels. (C) αCP proteins increase the efficiency of polyadenylation in vitro. The WT (left) and mutant (right) PRG2 and AES RNA substrates were incubated with HeLa cell nuclear extract (as described for panel B). Increasing equivalent amounts (0 μg, 0.3 μg, 0.6 μg, and 1.2 μg) of BSA or recombinant αCP2 were added to the indicated reaction mixtures. The reactions were terminated after a 90-min incubation, and the RNAs were analyzed on 6% denaturing PAGE for the addition of poly(A) tails. The PA efficiency, the ratio of labeled RNA in the poly(A) tail region divided by total RNA activity (polyadenylated plus remaining substrate), was quantified as indicated below the respective lanes (the activity at the lowest level of BSA for each set of reactions was defined as 1.0).

