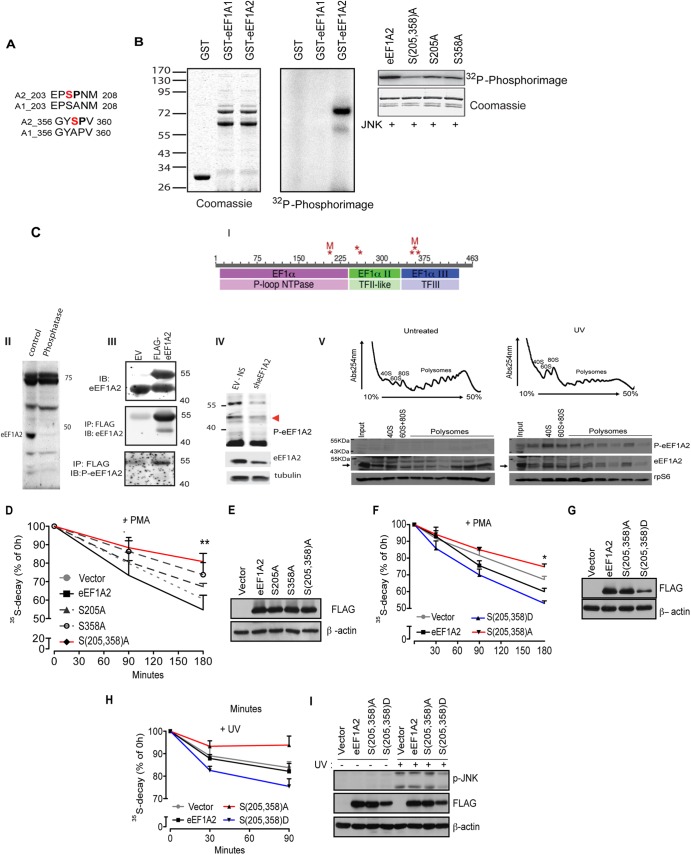
Fig 8.
JNK phosphorylates eEF1A2 at serines 205 and 358 to stimulate the degradation of NSPs (A) Pairwise alignment of regions of human eEF1A isoforms 2 (A2) and 1 (A1) surrounding the putative JNK phosphoacceptor sites (shown in red). (B) In vitro JNK kinase assay. The left panel shows the loading control (Coomassie blue staining) of in vitro phosphorylation assay performed with recombinant bacterially purified active JNK2α2 (30 ng) and glutathione S-transferase (GST)–eEF1A1 or GST-EF1A2 (1 μg each) in the presence of [γ-32P]ATP. In the middle panel, a 32P-autoradiogram shows that JNK2 preferentially phosphorylates eEF1A2. The right panel shows the results of an in vitro phosphorylation assay using JNK2 and wild-type GST-eEF1A2 or GST-eEF1A2 with alanine substitutions at Ser205 and Ser358 S(205,358)A, Ser205 (S205A), or Ser358 (S358A). After in vitro kinase reactions, eEF1A2 phosphorylation was visualized and quantified using phosphorimager (Fujifilm FLA-5100). Coomassie blue staining was performed to verify accurately equal amounts of all recombinant proteins. (C) Detection of eEF1A2 phosphorylation in cells. (i) Schematic diagram of phosphorylation sites identified on eEF1A2 by tandem mass spectrometry (MS/MS). Phosphorylation sites (S205, Y254, T261, S354, Y357 or S358, and T365) are indicated by asterisk. Sites mutated in the present study (S205, S358) are indicated by “M.” The three domains in eEF1A2 are indicated in the bars with the darker colors, and protein superfamilies to which these domains belong are indicated in the lighter-colored bars below. Phosphorylation site identification was made on each of the three domains, with two clusters of two or three adjacent sites. (II) Protein extracts prepared from hippocampus were subjected to mock (control) or treatment with protein phosphatases (phosphatase) following immunoblot analysis with antibodies to p-eEF1A2. (III) 293T cells were transfected with empty vector (EV) or FLAG-eEF1A2 and proteins were analyzed by Western blotting (lysates; upper panel) or after their immunoprecipitation with FLAG antibodies following immunoblotting with antibodies to eEF1A2 (middle panel) or with antibodies raised against the S358 phosphopeptide (p-eEF1A2) (lower panel). (IV) 293T cells were subjected to control KD (EV-NS) or KD with sh-eEF1A2. Proteins were analyzed by IB with p-eEF1A2 (upper panel) or total eEF1A2 antibodies (middle panel) or control loading tubulin (lower panel). (V) UV stimulates recruitment of phosphorylated eEF1A2 to polysomes. HEK293T cells were left untreated or UV irradiated for 1 min and harvested after 30 min. A total of 10 OD260 units of the corresponding cytoplasmic extracts were sedimented by centrifugation on 10 to 50% sucrose gradients. Polysome profiles were obtained by continuous monitoring of UV absorbance at 254 nm. 40S, 60S, and 80S indicate the positioning of respective ribosomal subunits and monosome on the gradient. The distribution of phosphorylated eEF1A2 was monitored across the gradient using a p-eEF1A2 and is detected on polysomes upon UV irradiation. Ribosomal protein rpS6 and total eEF1A2 were used as loading control. (D and E) HEK293T cells were transfected with an empty vector, FLAG-eEF1A2 (eEF1A2), FLAG-eEF1A2S205A (S205A), FLAG-eEF1A2S358A (S358A), or FLAG-eEF1A2S205A/S358A [S(205,358)A] and treated with 50 nM PMA for the indicated time points. The stability of NSPs was monitored by a [35S]Met-Cys pulse-chase. The effects of a double mutant [S(205,358)A] on degradation of NSPs were significantly lower than those observed for single mutants (S205A and S358A) or WT eEF1A2 (ANOVA, F4,29 = 4.802, P = 0.0052). The data are represented as mean values ± the SEM (n = 3). (F, G, H, and I) HEK293T cells transfected with an empty vector, FLAG-eEF1A2 (eEF1A2), FLAG-eEF1A2S205A/S358A [S(205,358)A], or FLAG-eEF1A2S205D/S358D [S(205,358)D] mutant were treated with PMA for the indicated time points (F and G) or exposed to UV for 90 s (see Materials and Methods) (H and I). Stability of NSPs was monitored by a [35S]Met-Cys pulse-chase at the indicated time points (+PMA [F], 30, 90, and 180 min; +UV [H], 30 and 90 min). The data are represented as mean values ± the SEM (n = 3). The stability of 35S-labeled polypeptides was significantly decreased in cells expressing S(205,358)D mutant compared to control cells and cells expressing S(205,358)A mutant [+PMA, (F), P = 0.0032, S(205,358)A compared to FLAG-S(205,358)D (180 min), ANOVA, F3,15 = 55.67, P < 0.0001; +UV (H), P = 0.050, S(205,358)A compared to vector (90 min), ANOVA, F3,32 = 4.56, P = 0.0090]. (G and I) Protein extracts (30 μg) were loaded onto SDS-PAGE gels, and the levels of FLAG-eEF1A2 variants and JNK phosphorylation (I) were monitored by Western blotting. β-Actin served as a loading control.

