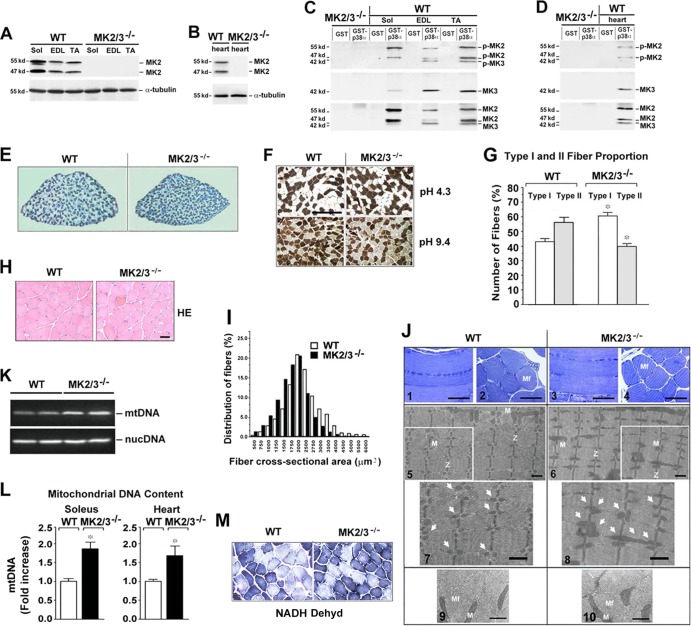
Fig 1.
MK2/3 deficiency increases the number of slow type I fibers and mitochondrial content in soleus muscle. (A to D) Western blot analysis of MK2 and MK3 abundance and phosphorylation in slow type soleus (Sol), fast type extensor digitorum longus (EDL) and tibialis anterior (TA) (A and C) and heart (B and D) muscles. α-Tubulin was used as a loading control. (C and D) GST-p38α pulldown experiments from whole-muscle lysates. To investigate the activity levels, an antibody against p-T222 of human MK2 that recognizes both murine p-MK2 and p-MK3 was used. Blots were stripped and reprobed with anti-MK3 and then with anti-MK2 antibodies. The positions of molecular mass markers (in kilodaltons) are indicated to the left of the blots. (E) Representative metachromatic ATPase staining of cross sections from entire soleus muscles. Slow type I fibers are stained in dark blue, and fast type II fibers in various shades of lighter blue. (F) ATPase fiber type analysis of soleus muscles at different pHs. Type I fibers stained dark at pH 4.3 and light at pH 9.4, and type II fibers exhibited the opposite. Bar, 200 μm. (G) Quantification (shown as a percentage) of type I and II fibers (n = 5) as analyzed in panel F at pH 4.3. Values that were significantly different (P < 0.05) from the values for the same fiber type from WT mice are indicated by an asterisk. (H) Sections of myofibers from WT and MK2/3−/− soleus muscle stained with hematoxylin and eosin (HE). Bar, 15 μm. (I) Frequency histograms of the distribution of cross-sectional areas (CSA) of HE-stained fibers as shown in panel H in whole soleus muscle (distribution of fibers shown as a percentage). (J) Representative light micrographs (panels 1 to 4) and transmission electron micrographs (panels 5 to 10) of longitudinal sections (panels 1, 3, and 5 to 8) and cross sections (panels 2, 4, 9, and 10) from WT and MK2/3-deficient solei. M, mitochondria (also indicated by arrows in panels 7 and 8 [enlargements of sections in panels 5 and 6]); Mf, myofibril; Z, Z-line. Bars, 100 μm (panels 1 to 4), 1 μm (panels 5 to 8), and 0.5 μm (panels 9 and 10). (K and L) Semiquantitative PCR (K) and qPCR (L) analyses of mitochondrial cytochrome B (mtDNA) and nuclear β-actin (nucDNA) DNA levels in soleus and heart muscles. In panel L, fold increase of mitochondrial DNA (mtDNA) relative to nuclear DNA (n = 8) is shown. The ratio of mtDNA to nuclear DNA in WT soleus was set at 1 (mean plus standard error of the mean [error bars] [SEM]. Values that were significantly different (P < 0.01) from those for WT mice are indicated by an asterisk. (M) Staining for NADH dehydrogenase (NADH dehyd) activity in WT and MK2/3−/− soleus.

