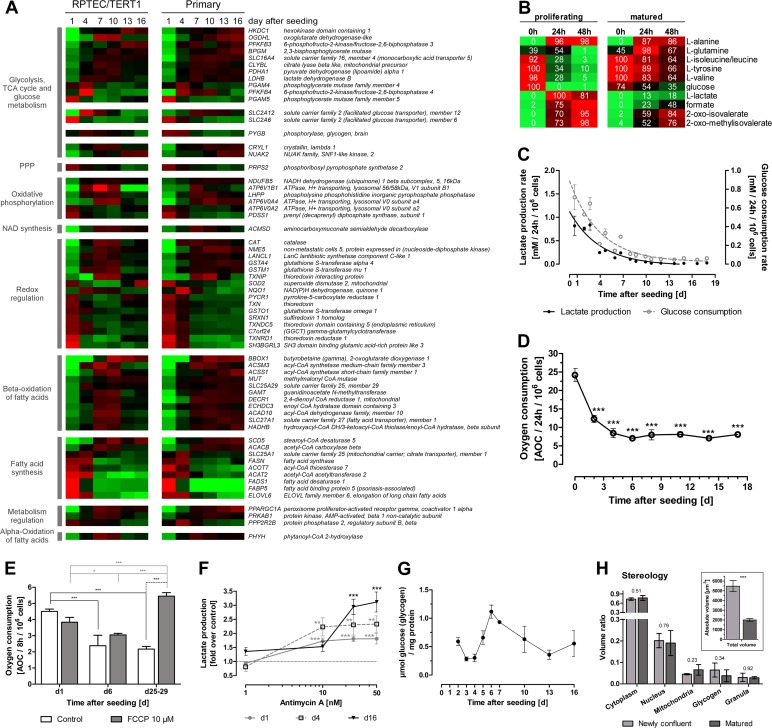
Fig 5.
Alterations in energy metabolism and mitochondrial function over monolayer formation and maturation. (A) Heat map of energy metabolism-associated genes. Genes are grouped according to their function in different metabolic pathways and then ranked within the group to the difference between day 1 and 16 values in the RPTEC/TERT1 data set. Average mean-centered mRNA expression values (log2) per time point and cell type are represented in red (higher expression compared to the mean) and green (lower expression compared to the mean) (n = 3). (B) Metabolic alterations measured by NMR in RPTEC/TERT1 supernatant. Values are minima and maxima, in percent, normalized per metabolite. Colors represent abundances of the respective metabolites, where red indicates high abundance and green indicates low abundance (n = 3). (C) Lactate production and glucose consumption rates over RPTEC/TERT1 maturation time. n = 3. (D) Oxygen consumption rate over RPTEC/TERT1 maturation time. Statistical significance was analyzed using one-way ANOVA with the Bonferroni multiple comparison test post hoc (n = 3). (E) Oxygen consumption of RPTEC/TERT1 cells after treatment with oxidative uncoupler FCCP for 8 h. Two-way ANOVA with the Bonferroni multiple comparison test post hoc was used to analyze statistical significance (n = 3). (F) Lactate production of RPTEC/TERT1 cells after treatment with the electron transfer chain complex III inhibitor antimycin A for 8 h. Statistical significance was analyzed using one-way ANOVA with the Bonferroni multiple comparison test post hoc to time-matched control (n = 3). (G) Glycogen storage at different time points after seeding (n = 3). (H) Relative volume of RPTEC/TERT1 cell fractions, as determined by stereology. Insert depicts the calculated absolute volume of newly confluent and matured cells. Statistical significance was analyzed by applying a two-tailed unpaired t test. P values are indicated above the bars (n = 3). (B to H) Experiments were performed with RPTEC/TERT1 cells. (C to H) Values are means ± SD. *, P < 0.05; **, P < 0.01; ***, P < 0.001. PPP, pentose phosphate pathway.

