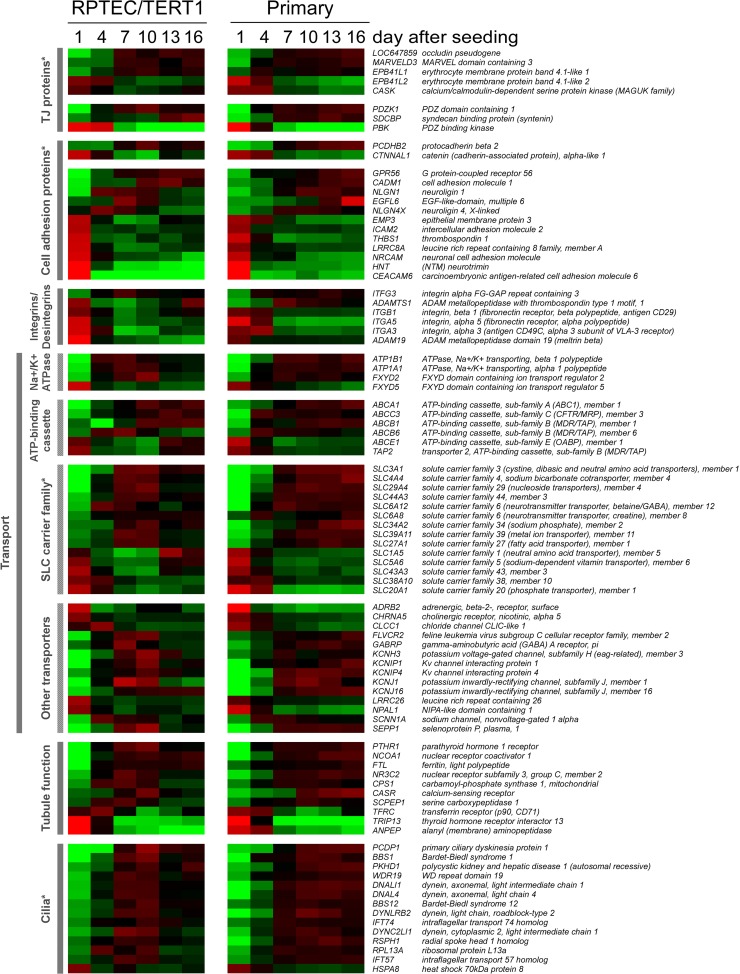
Fig 6.
Functional grouping of genes exhibiting time-dependent expression during epithelial monolayer maturation. Genes were ranked within the allocated group according to the difference between day 1 and 16 values in the RPTEC/TERT1 data set. Cell colors reflect the value and direction of the expression value relative to the mean over all time points (red indicates higher expression and green indicates lower expression compared to the mean) (n = 3). An asterisk indicates that the group contains members that are shown in previous heat maps.

