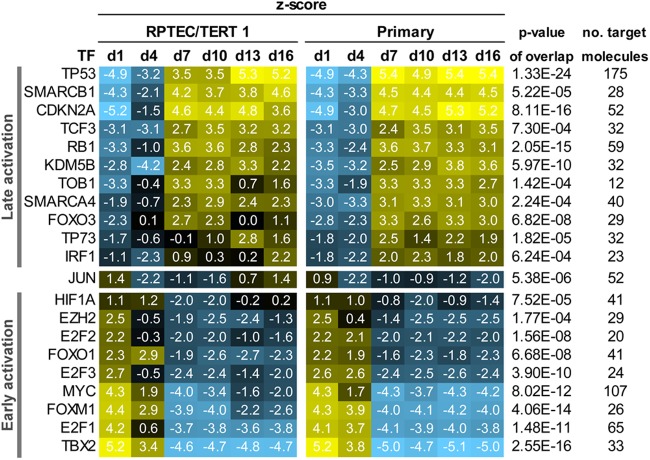
Fig 7.
Predicted transcription factors (TFs) involved in the maturation process. Colors reflect the regulation z score and direction of regulation: yellow indicates activation and blue indicates inhibition of the given TF. All TFs in this table had a P value of <0.001 for the overlap and a z score of >2 or <−2 at at least one time point in both cell models.

