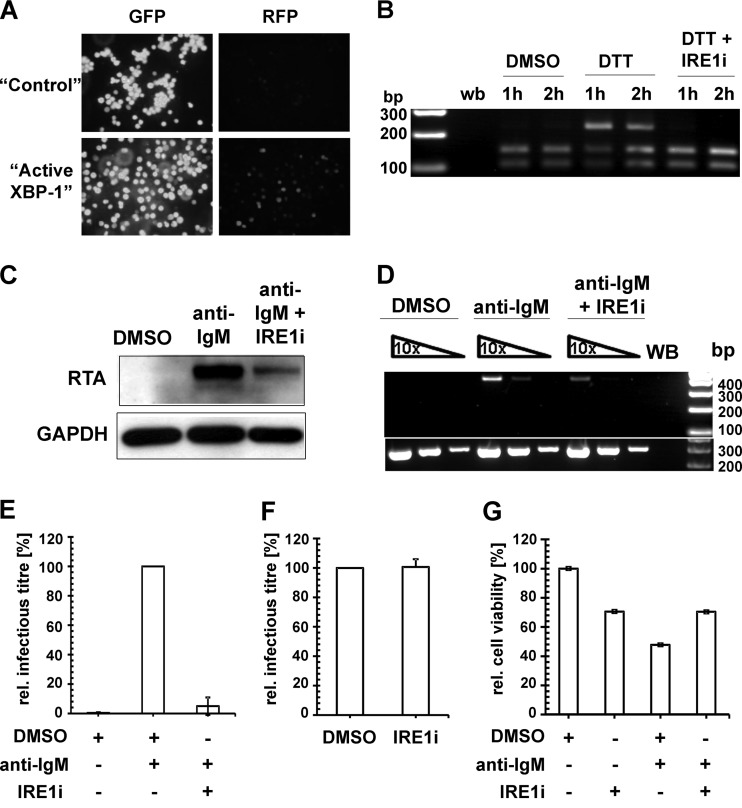
Fig 7.
Lytic KSHV induction following BCR activation requires the splicing of XBP-1 mRNA. (A) Confocal images of BrK.219 cells transduced with lentiviral vectors expressing either GFP (“control”) only or the spliced form of XBP-1 (“active XBP-1”). Expression of RFP marks RTA-expressing BrK.219 cells. (B) RT-PCR analysis of the DTT-induced splicing of XBP-1 transcript in BrK.219 cells with or without treatment with IRE1α inhibitor (IRE1i; 25 μM). cDNA products derived from the spliced XBP-1 mRNA are resistant to PstI digestion (upper band, 223 bp), whereas the products for the unspliced XBP-1 mRNA are cleaved (the two lower bands, 104 and 145 bp). WB denotes water blank control. The band sizes (in bp) of the DNA ladder are as indicated. (C) Western blot analysis of KSHV RTA induction by anti-IgM antibodies (1 μg/ml) with or without IRE1i (25 μM) treatment. (D) Semiquantitative RT-PCR analysis of a KSHV late gene (ORF29) expression at 48 h posttreatment (upper panel), using serially 10-fold-diluted cDNA obtained from BrK.219 cells treated with either DMSO, anti-IgM antibodies (1 μg/ml), or anti-IgM antibodies plus IRE1i (25 μM). Input cDNA was normalized to a cellular gene (β2M lower panel). Primers for both virus and cellular genes span across intron(s), and no amplification of genomic DNA was observed under the PCR conditions used. The data from one representative experiment out of two independent experiments are shown. (E) Relative KSHV titer in supernatants from BrK.219 cells 3 days after BCR cross-linking, with or without the presence of IRE1i. Cell supernatants from BrK.219 cells treated with either DMSO, anti-IgM, or anti-IgM plus IRE1i were titrated on TE671 cells. The data are shown as the relative infectious titer where all samples were normalized to the positive control (anti-IgM) as 100% and plotted as means ± the standard deviations from three independent experiments. (F) Effect of IRE1i on the relative KSHV titer of anti-IgM induced supernatant from BrK.219 cells. The cell supernatant from BrK.219 cells induced with anti-IgM was split into two, and each half mixed with either DMSO or IRE1i; the resulting supernatants were titrated on TE671 cells. The data are shown as relative infectious titer where all samples were normalized to the positive control (anti-IgM plus DMSO) as 100% and plotted as means ± the standard deviations from three independent experiments. (G) The relative cell viability of BrK.219 cells treated with either DMSO, IRE1i, anti-IgM plus DMSO, or anti-IgM plus IRE1i is plotted as the percent concentration of ATP (proportional to the number of live cells) normalized to the DMSO control as 100%. The data (means ± the standard deviations) from one representative experiment out of two independent experiments are shown.

