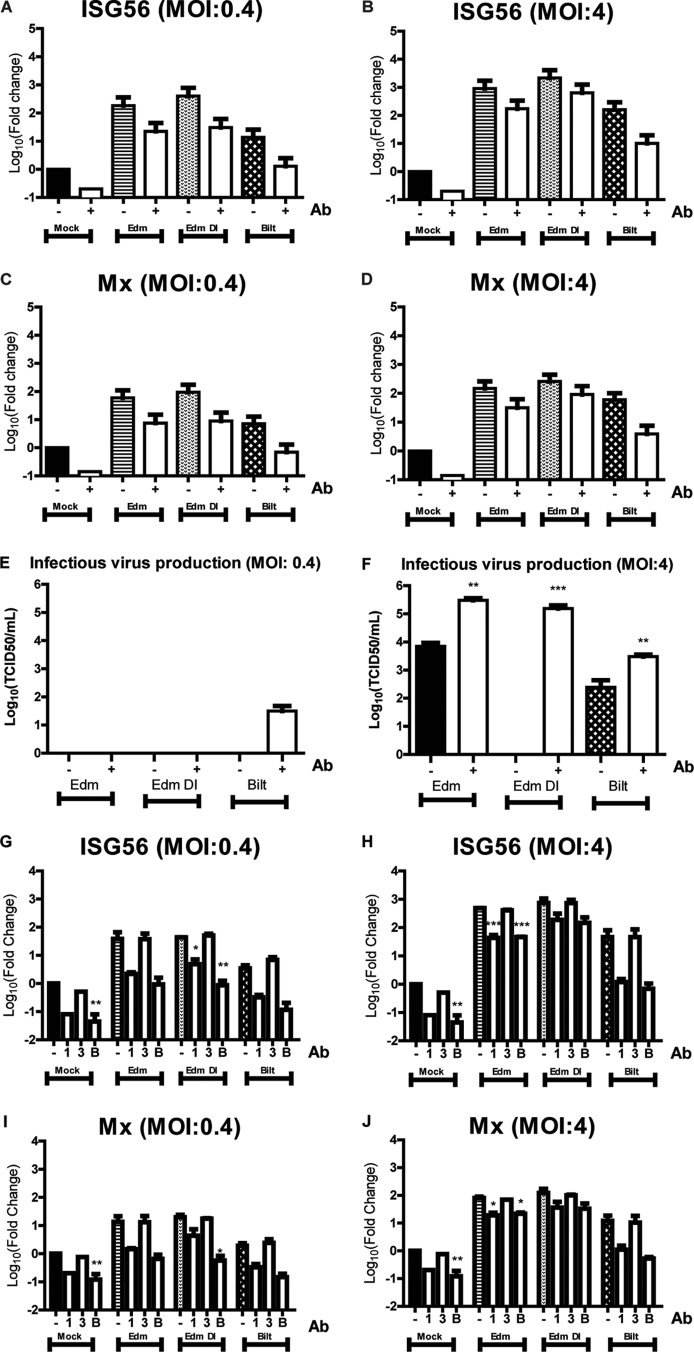
Fig 10.
Levels of ISG expression and virus production after infection of moDCs in the presence of IFN neutralizing antibodies. (A to F) moDCs infected by MeV at an MOI of 0.4 or 4 in the presence of IFN-α and IFN-β neutralizing antibodies. mRNA levels of ISG56 (A and B) and Mx (C and D) compared to those in mock-infected cells. (E and F) Production of infectious virus. (G to J) moDCs were infected by MeV at an MOI of 0.4 or 4 in the presence of antibodies against type I IFN receptor only (1), type III IFN receptor only (3), both antibodies (B), or no antibodies (−). mRNA levels of ISG56 (G and H) and Mx (I and J) compared to those of mock-infected cells without neutralizing antibodies. Graphs show the mean log10 fold change ± SEM from 2 donors of the CT values compared to mock-infected cells. *, P < 0.05; **, P < 0.005; ***, P < 0.0005. Student's t tests or one-way ANOVA with Bonferroni multiple-comparison tests was used to compare the mRNA fold changes and virus titers to the no-antibody control.

