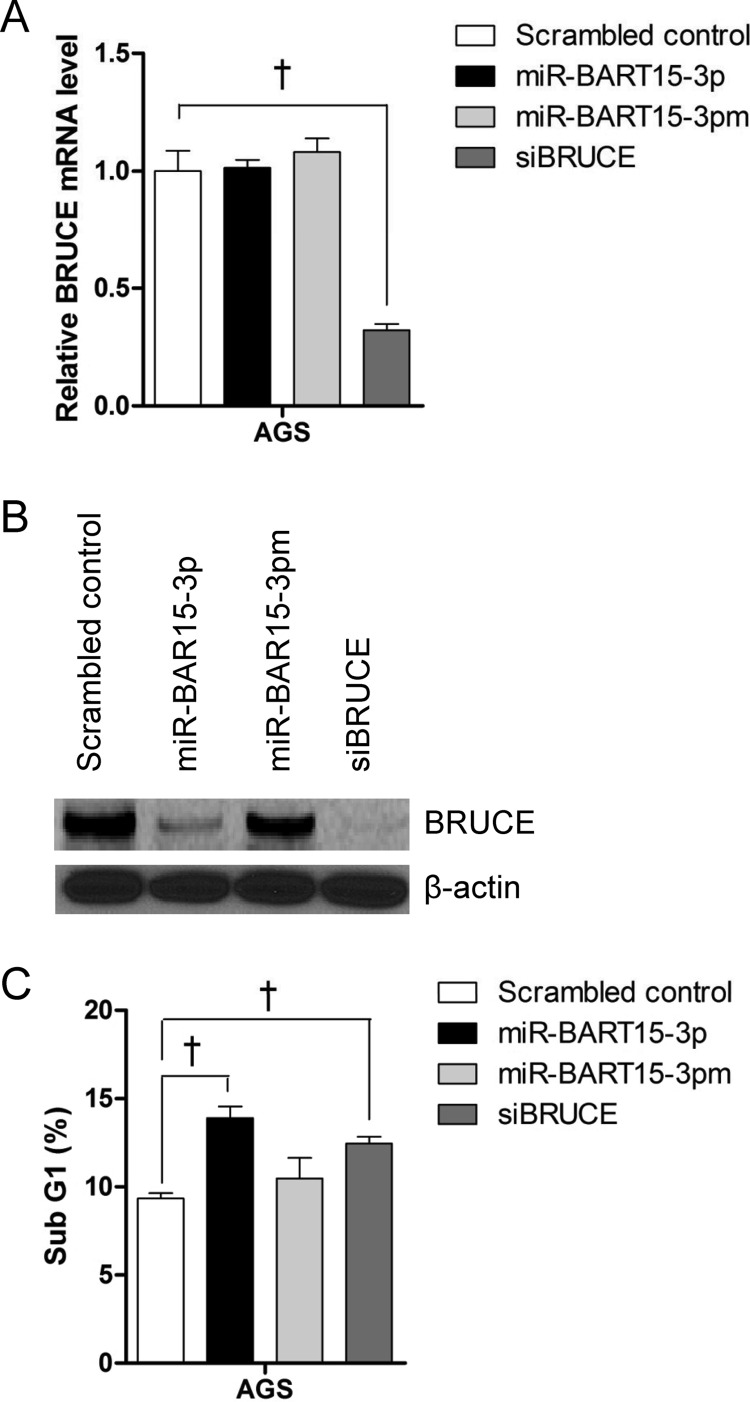
Fig 8.
Effect of siRNA for BRUCE (siBRUCE) on BRUCE expression and apoptosis. The expression levels of BRUCE mRNA (A) and protein (B) in AGS cells 48 h after transfection with the miR-BART15-3p mimic siBRUCE or the scrambled control were measured by qRT-PCR and Western blot, respectively. GAPDH and β-actin were used as internal controls for qRT-PCR and Western blot, respectively. (C) AGS cells were transfected with the miR-BART15-3p mimic siBRUCE or the scrambled control. The proportion of the sub-G1 cell population was measured after 72 h by PI staining and FACS analysis. Error bars indicate SD (n = 3). †, P < 0.01.

