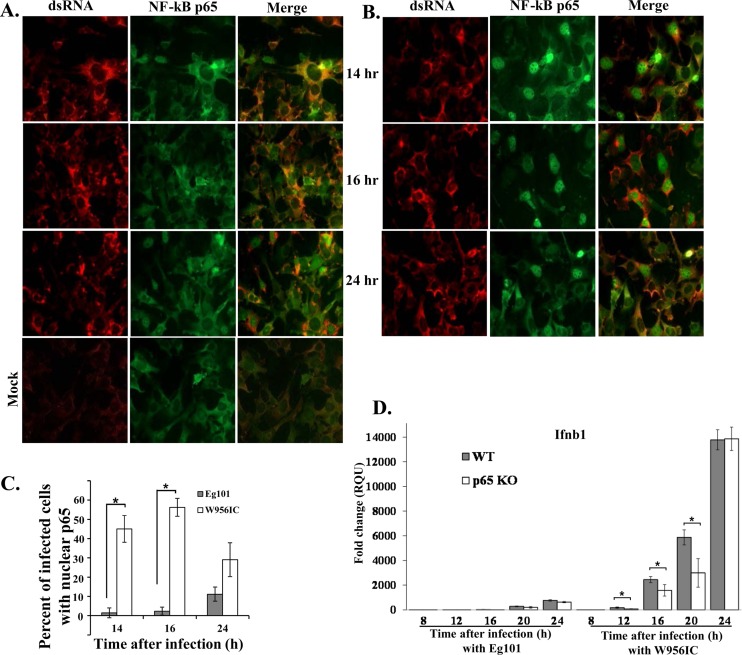
Fig 5.
Analysis of NF-κB p65 cellular localization. C3H/He MEFs were infected with Eg101 (A) or W956IC (B) virus (MOI of 5). At the indicated times after infection, cells were stained with anti-dsRNA (red) and anti-NF-κB antibody (green) and analyzed by laser scanning confocal microscopy. (C) Quantification of the percentage of infected cells with nuclear p65 localization was done at the indicated times after infection. At least three fields of cells for each condition were counted, and average values were plotted. Bars represent ± standard deviations. Asterisks indicate statistically significant differences (*, P < 0.05). (D) p65−/− MEFs (p65 KO, where KO is knockout) and p65−/− MEFs reconstituted with p65 (WT) were infected with Eg101 or W956IC at an MOI of 1, and replicate cultures were processed to extract total cell mRNA at the indicated times after infection. Ifnb1 mRNA levels detected by real-time qRT-PCR were normalized to the levels of GAPDH in the same sample and are shown as the fold change compared to the level of the Ifnb1 mRNA in mock-infected cells. Samples from each qRT-PCR experiment were assayed in triplicate. Error bars represent the SE of the mean. Representative data from one of three independent experiments are shown.

