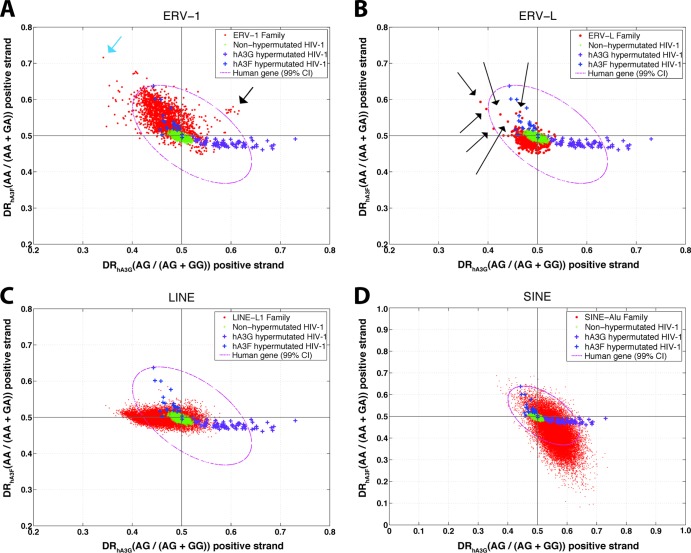
Fig 5.
Diagnostic ratio of hA3G versus that of hA3F in ERV-1 (A), ERV-L (B), L1 (C), and SINE Alu (D) families. Each point in this plot is a sequence belonging to ERV-1 (red circles) in panel A, ERV-L (red circles) in panel B, L1 (red circles) in panel C, SINE-Alu (red circles) in panel D, nonhypermutated HIV-1 (green plus signs), HIV-1 hypermutated by hA3G (purple plus signs), HIV-1 hypermutated by hA3F (blue plus signs). The 99% confidence interval (CI) of human genes is shown by a magenta dotted oval.

