
Fig 8.
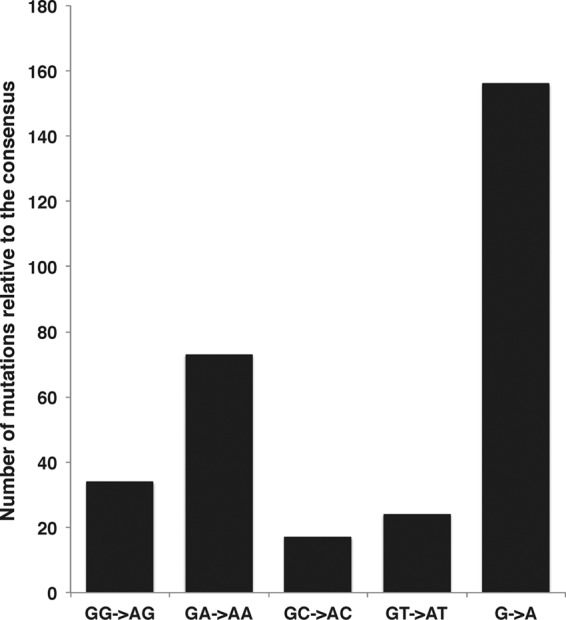
Analysis of the hypermutation footprint of hA3G and hA3F on a suspected LTR25 sequence from the ERV-1 family. Twenty-two LTR25 sequences were aligned using MAFT, and a consensus sequence was generated to compare against the potentially hypermutated LTR25 sequence, using the Hypermut2 program from the Los Alamos National Laboratory. The vertical axis shows the number of mutations against the consensus sequence. The bars represent the total number of G-to-A changes as well as changes within different sequence contexts.