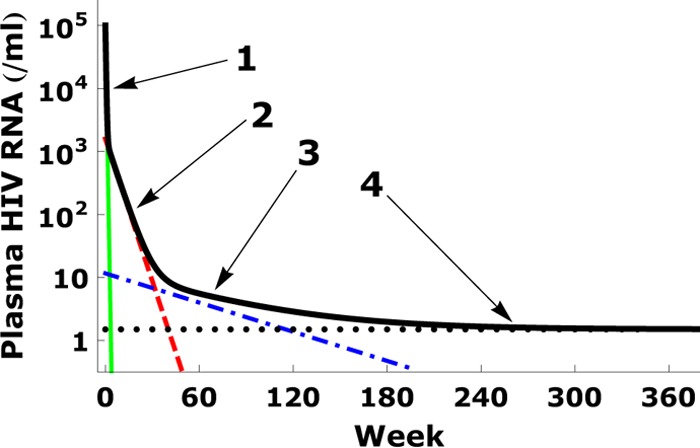
Fig 1.

Four-phase decay of plasma viral load. The median viral load decay observed by Palmer et al. (8) is shown by the thick black line. The four phases are indicated by the arrows, and the four corresponding terms in equation 1 are shown by solid (green), dashed (red), dash-dotted (blue), and dotted (black) lines, respectively, where we use V1(0) = 105 copies/ml, V2(0) = 103.2 copies/ml, V3(0) = 11.6 copies/ml, and V4(0) = 1.5 copies/ml, as well as half-lives τ1 = 1.5 days, τ2 = 4 weeks, and τ3 = 39 weeks, as reported in the work of Palmer et al. (8).
