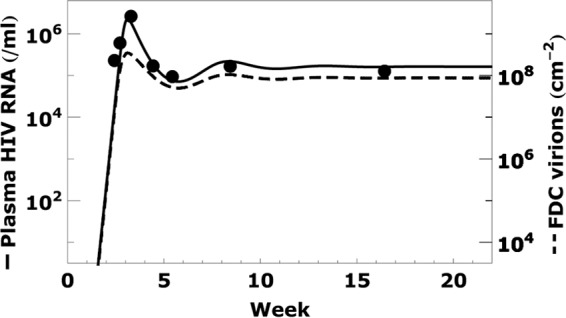
Fig 3.

Acute infection dynamics. The plasma viral RNA load in an acutely infected patient (dots) and best fit curve (solid line) are taken from the work of Stafford et al. (43). The density of virions bound to FDC (dashed line), calculated using the generalized form of equations 2 and 3, changes with the plasma viral load. The parameter values used in the calculation, chosen to fit the clinical data (8, 38), are σn = 7, association rate constant kx = 0.38 k−x/<RT>, and those listed in Table 1.
