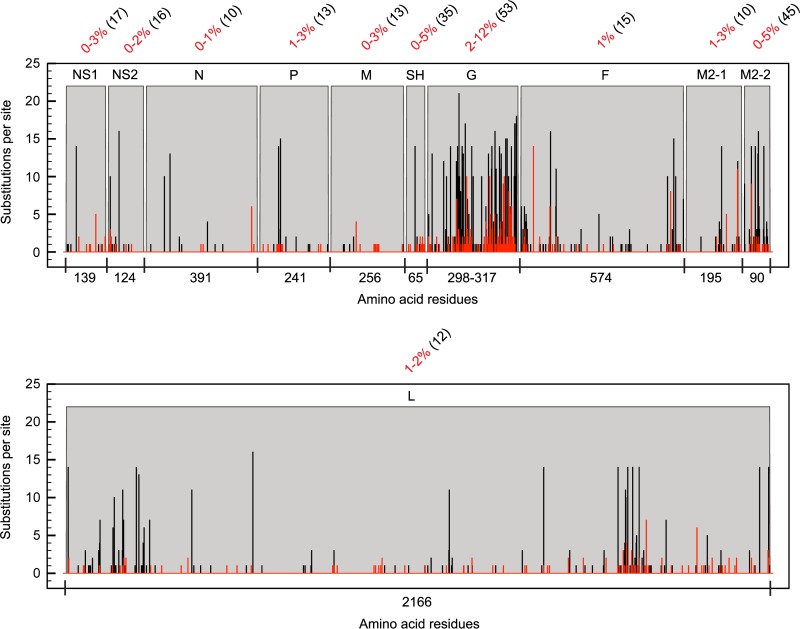
Fig 1.
RSV protein sequence variability. The number of substitutions per site for RSV-A (black bars) and RSV-B (red bars) and the protein sequence variability (percent numbers in red) in each RSV-B protein were calculated per strain relative to the consensus. The numbers within parentheses indicate percentages of protein sequence variability between the consensus sequences of type A and type B RSV strains.

