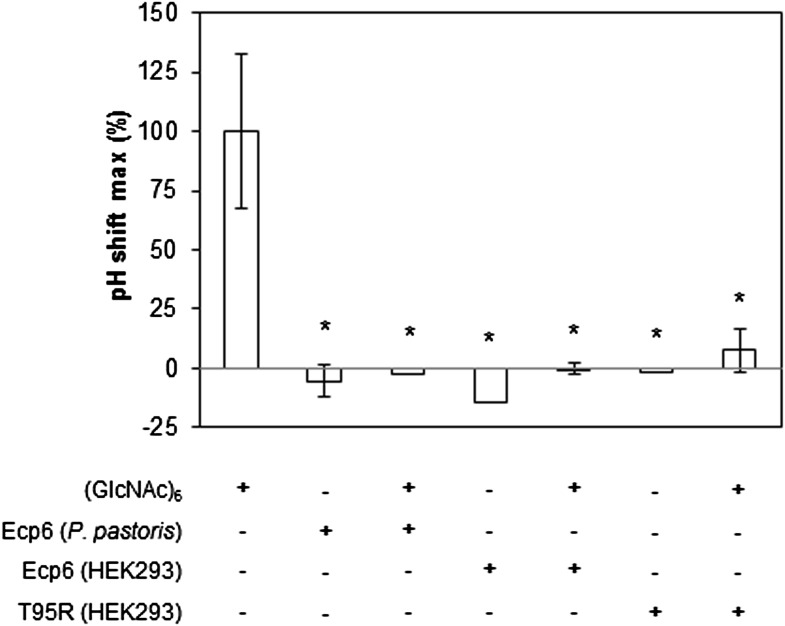
Figure 6. Prevention of chitin-triggered medium alkalinization in the tomato cell suspension assay by Ecp6 and T95R produced in HEK293 cells.
The maximum pH shift determined on treatment with 10 nM (GlcNAc)6 and 100 nM Ecp6 or T95R mutant after normalization to treatment with (GlcNAc)6 in the absence of Ecp6 is represented. Bars present averages of three replicates with standard deviations. Significant differences with (GlcNAc)6 treatment are indicated with asterisks, and significant differences with Ecp6 treatment are indicated with plusses (t-test p≤0.05).

