Fig 9.
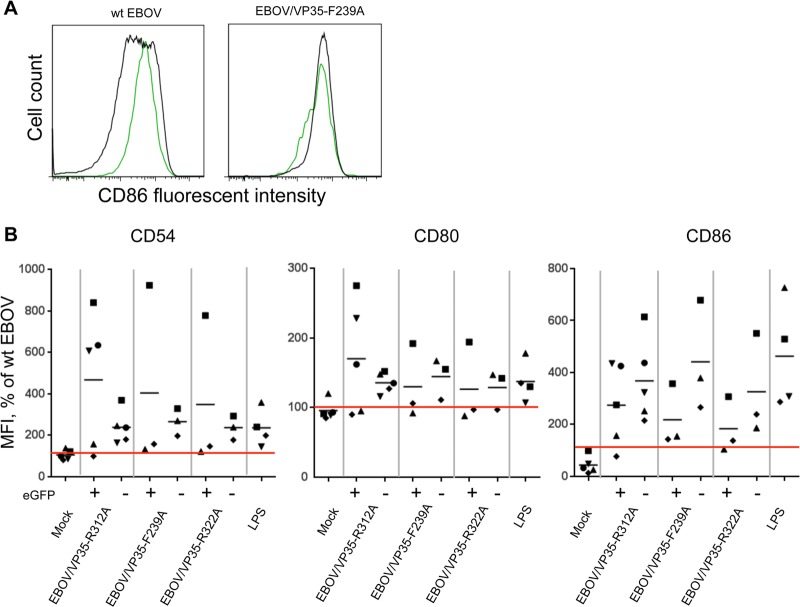
The mutated EBOVs induce maturation regardless of the level of infection. (A) CD86 expression in EGFP+ (green histograms) and EGFP− (black histograms) DC. (B) Expression of the three maturation markers in EGFP+ and EGFP− DC infected with the four mutants and normalized to the levels of the markers in DC infected with wt EBOV (100%). The log10 MFI values ± SE for EGFP+ DC infected with wt EBOV were 3.1 ± 0.3, 3.4 ± 0.1, and 3.1 ± 0.2 for the three markers of maturation, and the respective values for EGFP− DC were 3.5 ± 0.2, 3.7 ± 0.1, and 2.9 ± 0.2. Values for each donor are indicated by the same symbol in each plot, and the mean values are indicated by horizontal bars. No statistical difference between EGFP+ and EGFP− DC was observed for any of the three markers of activation for any virus.

