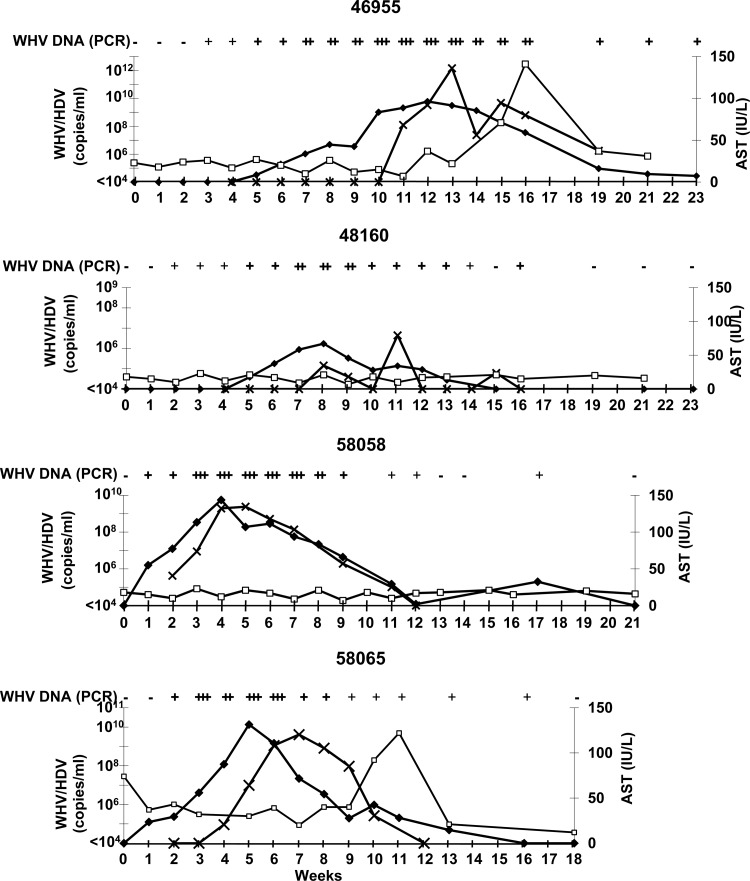
Fig 5.
Course of simultaneous WHV/HDV infection in four naive controls. Kinetics of HDV RNA (x) (LC-PCR), WHV DNA (♦) (qualitative and quantitative PCRs in copies/ml), and AST (□) (IU/liter) starting with challenge in week 0 are shown (−, not detectable; +, ++, and +++, different strengths of positive signals).

