
Fig 3.
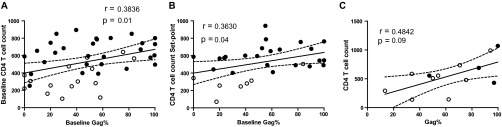
Correlation between the relative baseline immunodominance of anti-Gag response and CD4+ T-cell counts. (A) Baseline CD4+ T-cell count versus baseline percentage of anti-Gag response in PHI subjects. (B) Set point CD4+ T-cell count versus baseline percentage of anti-Gag response in PHI subjects. (C) CD4+ T-cell count versus percentage of anti-Gag response in chronics. In panels A and B, black and white dots denote PHI > 350 and PHI < 350 subjects, respectively. In panel C, black dots correspond to viremic controllers within the chronic group. All r and P values correspond to Spearman's test.