
Fig 8.
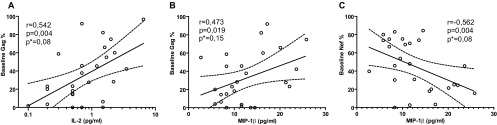
Correlation between anti-Gag and anti-Nef cellular immune response immunodominance hierarchy and plasma cytokine/chemokine levels in PHI subjects at baseline samples. Significant correlations were found between the relative immunodominance of Gag (A and B) and Nef (C) with plasma IL-2 (A) and MIP-1β (B and C) levels. r and P values correspond to Spearman's test. *, P values adjusted by the Benjamini and Hochberg method for false discovery rate (FDR) procedure.