Table 5.
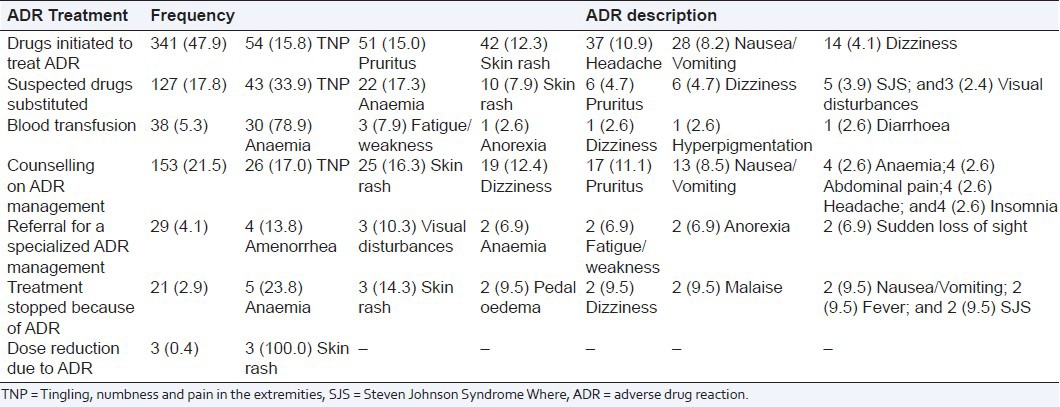
Frequency distribution of the actions taken to treat suspected adverse drug reaction segregated by the related ADR cases; percentages are in parenthesis, n = 712

Frequency distribution of the actions taken to treat suspected adverse drug reaction segregated by the related ADR cases; percentages are in parenthesis, n = 712
