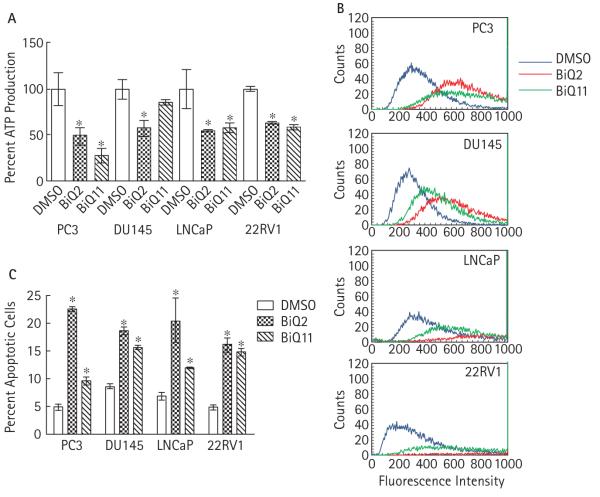
FIG. 3.
A, ATP production after adjustment for viable cell number after treatment of prostate cancer cell lines with vehicle or 10 μM of BiQ2 or BiQ11 for 4 h. *P < 0.05 compared with DMSO-treated samples. B, Flow cytometric analysis to detect the accumulation of fluorescent, oxidized DCFDA (right shifted) after treatment with DMSO or 10μM BiQ2 or BiQ11 for 2 h. C, Percent of cells undergoing apoptosis (Annexin V-positive, PI-negative) comparing treatment with DMSO with that with 10μM BiQ2 or BiQ11 for 4 h. *P < 0.05 compared with DMSO treated samples.

