
Figure 3. Active-site cavity.
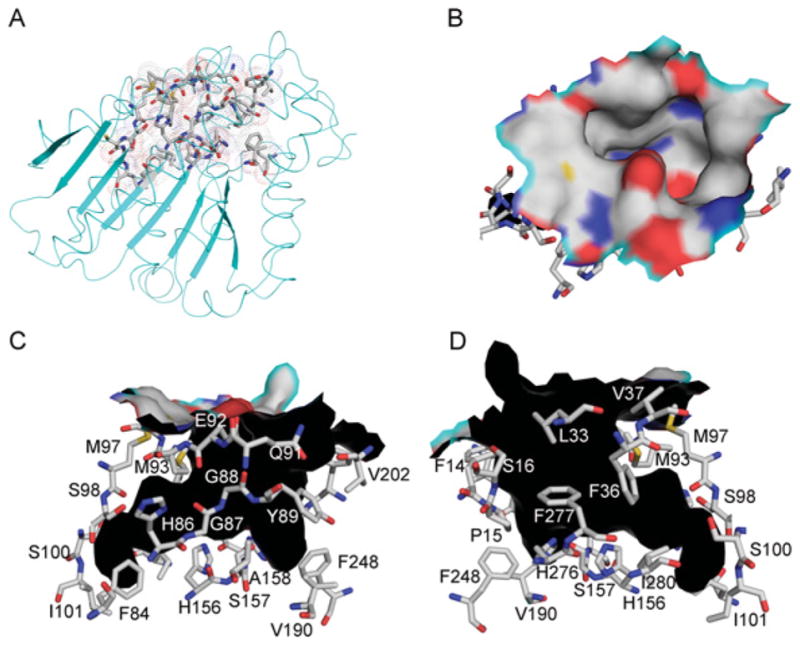
(A) KFase structure is shown as a cartoon diagram. The residues forming the active-site cavity are shown as sticks and a dot surface. (B) The top view of the surface of the active-site cavity. C, N, O and S atoms are coloured as silver, blue, red and yellow respectively. (C) One side view of the active-site cavity wall. The cavity shape is shown in black. The residues forming active-site cavity surface are shown as sticks. (D) The other side view of the active-site cavity wall.