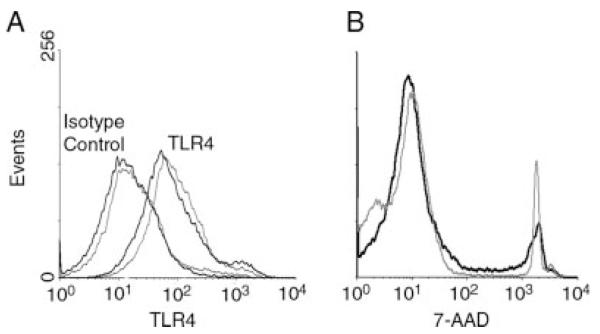
FIGURE 4.
myDCs from B6 and MRL/lpr mice have similar levels of TLR4 surface expression and no difference in survival. myDCs within the CD11c+ splenocyte population were gated as CD11chigh/CD11bint/high, and then analyzed for TLR4 expression (A). LPS-stimulated BMDCs were stained with 7-AAD on day 4 (B). The thick black line represents B6 mice. The thin gray line represents MRL/lpr mice. Histogram shows a representative plot from three experiments.

