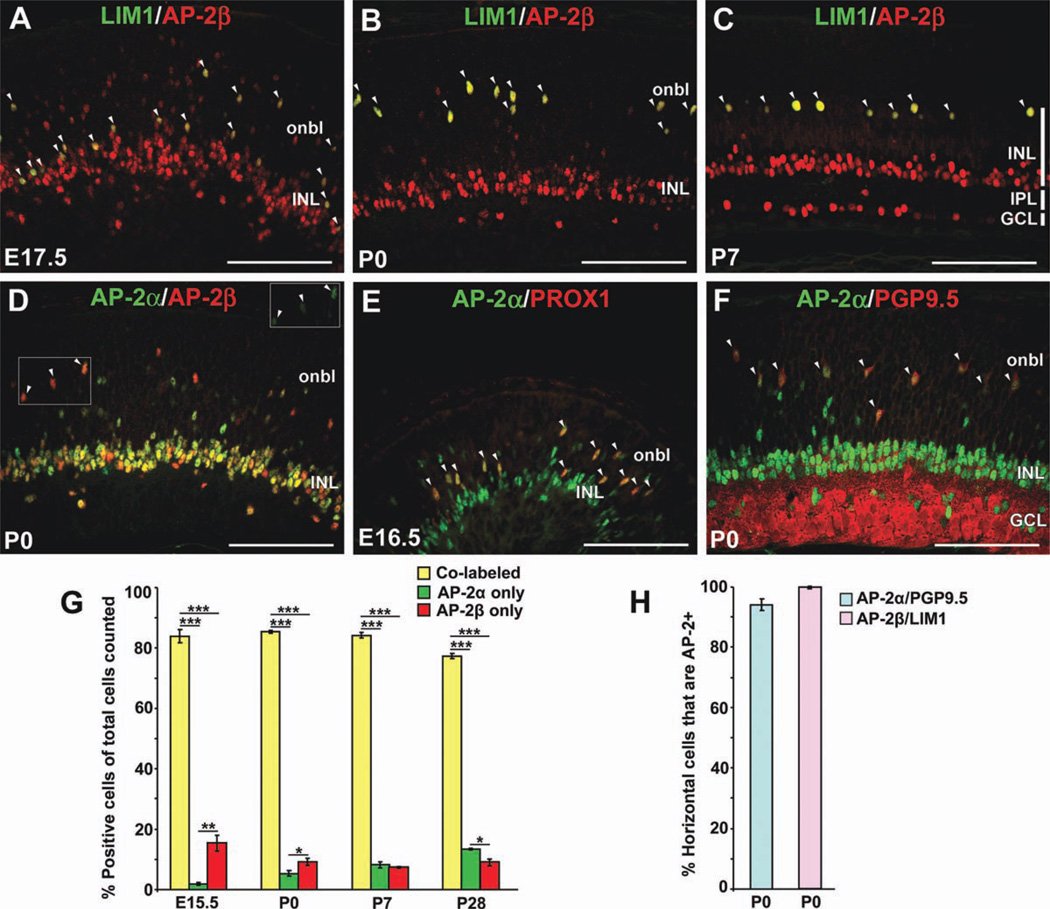
Fig. 2. Both AP-2α and AP-2β are expressed in developing mouse horizontal cells, although AP-2α expression is transient.
A–F: Co-immunolabeling with anti-LIM1 (green) and anti-AP-2β (red; A–C); anti-AP-2α (green) and anti-AP-2β (red; D); anti-AP-2α (green) and anti-PROX1 (red; E); or anti-AP-2α (green) and anti-PGP9.5 (red; F) on horizontal sections of wild-type eyes, at the stages indicated. All LIM1-positive horizontal cells are AP-2β-positive (A–C, arrowheads). Arrowheads in D denote cells that are strongly AP-2β-immunoreactive and also more weakly AP-2α-immunoreactive (inset). Arrowheads in E and F point to PROX1-positive or PGP9.5-positive horizontal cells that co-express AP-2α. G: Quantification of the proportions of co-labeled versus singly labeled cells in the total AP-2 population examined (AP-2α and/or AP-2β-positive), at the stages indicated. Note that the relative proportions of co-labeled versus singly labeled cells were not significantly affected by the stage examined. H: Quantification of the proportion of PGP9.5-positive horizontal cells expressing AP-2α and proportion of LIM1-positive cells expressing AP-2β at P0. Bars represent the mean ±SEM of counts from 3 animals. onbl, outer neuroblast layer; INL, inner nuclear layer; GCL, ganglion cell layer; IPL, inner plexiform layer. ***P < 0.001; **P < 0.01; *P < 0.05. Scale bars = 100 µm.

