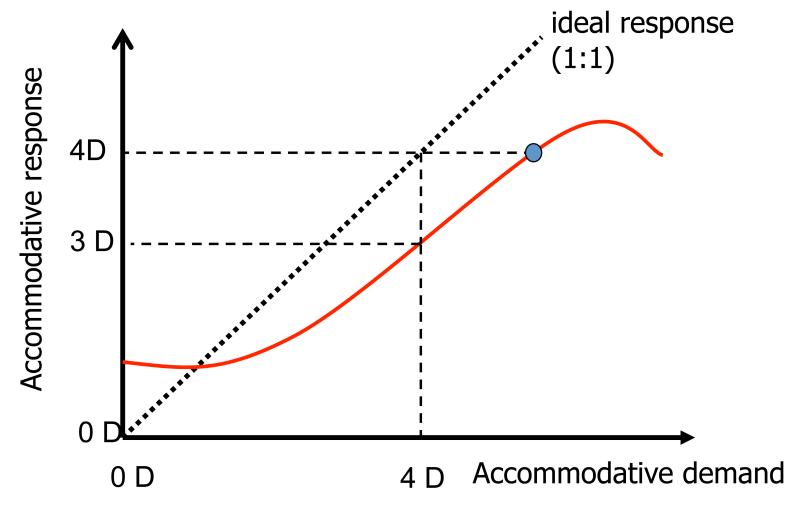
Figure 1.
Classic accommodative response curve in which accommodative response (refractive state of relaxed eye – refractive state of accommodated eye) in dioptres is plotted as a function of accommodative demand (refractive state of relaxed eye – target vergence) in dioptres. For this example an accommodative demand of 4D elicits an accommodative response of 3D, indicating a lag (demand-response) of 1 D. Although this eye has the ability to accommodate 4D (small circle), lag persists even though improved focusing would improve retinal image quality by reducing defocus blur.

